Analysis of waste management effect on the climate related disease in Larangan Village, Sidoarjo
Article information

Abstract
The repercussions of climate change have profound implications for human health, leading to the emergence of climate-related diseases. Recognizing this, the Ministry of Environment and Forestry in Indonesia has established the Climate Village Program to tackle and mitigate the impact of climate change. Despite the implementation of this program, Larangan Village in Candi Sub-district, Sidoarjo Regency, continues to struggle with cases of climate-related diseases. This research aims to assess the impact of waste management on the prevalence of climate-related diseases in Larangan Village. Using a quantitative, analytical, observational approach with a cross-sectional design, the study concentrates on two neighborhoods within Larangan Village. The population consists of 330 families in the 2nd neighborhood (Non-Climate Village Program) and 344 families in the 9th neighborhood (Climate Village Program), with a sample size of 109. The variables under investigation encompass waste management and climate-related diseases. Data collection involves conducting interviews and distributing questionnaires among community members in both neighborhoods. The collected data undergo analysis using Multigroup Analysis SEM PLS with a significance level of 0.05. The findings reveal a significant negative correlation between waste management and climate-related diseases, suggesting that enhanced waste management is linked to a reduced incidence of such diseases in the community.
Introduction
Humans require clean, breathable air for survival. Regrettably, the current state of the atmosphere consists not of pure air but rather a blend of gases and particulates, forming air pollutants or substances. Human activities contribute to air pollution, including pollutants from materials, natural sources such as volcanoes and forest fires, and biological processes like nitrification and denitrification.
Air pollution contributes to the occurrence of climate change. According to the Intergovernmental Panel on Climate Change [1], climate change is defined as a significant alteration in climate or climate variability that persists over an extended period, typically one decade or longer [1]. The consequences of climate change, such as rising sea levels, elevated temperatures, extreme weather events, and the increased occurrence of droughts, floods, and wildfires, have substantial implications for human health and well-being [2]. The health effects associated with climate change include air pollution, water and foodborne illnesses, vector-borne diseases, malnutrition, mental disorders, and heat stress [3]. The impacts of climate change on health contribute to the emergence of climate-related diseases.
In response to the challenges posed by climate change in Indonesia, the Ministry of Environment and Forestry has enacted the Climate Village Program policy. According to Regulation of the Ministry of Environment of the Republic of Indonesia Number 19 of 2012, Article 1 Paragraph 2, the Climate Village Program is a national initiative aimed at encouraging communities and all stakeholders to undertake local measures to enhance resilience to the impacts of climate change and to reduce greenhouse gas (GHG) emissions. This is achieved by implementing the Climate Village Program through a combination of adaptation and mitigation actions, with support from community groups focused on environmental health [4].
By the year 2022, Indonesia had documented 4,218 villages enrolled in the Climate Village Program, with a goal of reaching 20,000 such programs by 2024. In East Java Province, specifically, 500 locations had joined the Climate Village Program by the conclusion of 2022 [5]. Remarkably, the ninth neighborhood of Larangan Village in Candi District, Sidoarjo Regency, is the only location in Sidoarjo Regency that has proposed a Climate Village Program. However, based on data from the Primary Health Centre of Candi in 2022, Larangan Village has reported several cases of climate-related diseases, including 2 cases of dengue fever, 566 cases of upper respiratory tract infection (URTI), and 85 cases of diarrhea [6].
In light of this issue, this study aims to analyze the impact of waste management on climate-related diseases in both the Climate Village Program (9th neighborhood) and Non-Climate Village Program (2nd neighborhood) areas of Larangan Village, Candi Sub-district, Sidoarjo Regency.
Materials and Methods
This research utilized quantitative methods with an analytical and observational approach. The study employed a cross-sectional design, focusing on the analysis of the impact of waste management on climate-related diseases.
The study's population consisted of communities residing in two neighborhoods within Larangan Village, specifically the second and 9th neighborhoods. The 9th Neighborhood had proposed the Climate Village Program, while the 2nd Neighborhood had not participated in it. The total population under investigation comprised 344 families in the 9th Neighborhood and 330 families in the 2nd Neighborhood, totaling 674 households (as per data from Larangan Village's website). Calculated using the Lemeshow formula, the initial research sample size was determined to be 84. To account for potential non-compliance among respondents or potential dropouts, the sample size was increased by 30%, resulting in a minimum research sample size of 109.
The variables employed in this study include waste management (X), which comprises the availability of waste management facilities (X1), organic waste (X2), and non-organic waste (X3). Additionally, climate-related diseases (Y) encompass upper respiratory tract infection (URTI) (Y1), diarrhea (Y2), dengue hemorrhagic fever (DHF) (Y3), and dermatitis (Y4).
Data collection involved conducting interviews with communities in the 9th and 2nd neighborhoods regarding waste management and climate-related diseases, as well as distributing questionnaires. The collected data will be analyzed using Multigroup Analysis SEM PLS with a significance level of 0.05.
Results and Discussion
In this study, we examined the impact of waste management on climate-related diseases using Partial Least Squares analysis. The research analysis employed a second-order factor model with measurement model estimation utilizing the embedded two-stage approach, which consists of two stages used to assess the relationships between variables.
The embedded two-stage approach first stage
In the initial stage, the variable measurement model employed repeated indicators to evaluate the first-order measurement (dimension to variable relationship) and derive latent variable scores. Subsequently, in the first stage, an outer model evaluation was conducted to assess validity and reliability at the dimension level.
Evaluation of outer model (measurement model) dimension level
This measurement model includes tests for validity and reliability. Below is an image depicting the results of the Outer model construct loading factor model.
a. Dimension level convergent validity
The findings presented in Table 1 indicate that the majority of measurement items assessing dimensions at the first-order level are considered valid, with loading factors exceeding 0.7. However, two specific measurement items, namely items D1 and IS4, exhibit values slightly above 0.6, which are still deemed acceptable according to the model [7]. Additionally, the overall Average Variance Extracted (AVE) value is considered satisfactory, signifying good Convergent Validity and surpassing the threshold of 0.5.

Convergent validity level of dimension of Waste Management variable against Climate-Induced Disease.
b. Dimension level construct reliability
The summary in Table 5.4.1.1 displays the results of the composite reliability and Cronbach's alpha calculations. In general, both the composite reliability and Cronbach's alpha values, which assess dimensions, surpass 0.7. These values indicate that all measurement items evaluating each dimension are considered consistent and reliable in their measurements [8].
c. Dimension level discriminant validity
This examination can be conducted using the Heterotrait-Monotrait Ratio (HTMT). The results of the PLS measurement model indicate that the HTMT measure is considered less acceptable when a variable displays an HTMT value exceeding 0.90.
The table results indicate that all HTMT values within each dimension are below 0.90, demonstrating the theoretical differentiation between dimensions. This differentiation has been verified through statistical analysis.

Convergent validity level of dimension of Waste Management variable against Climate-Induced Disease.
The embedded two-stage approach 2nd stage
The second stage requires an outer model evaluation at the variable level, followed by a structural evaluation and an assessment of the model's overall quality.
1. Evaluation of outer model (measurement model) evaluation
The evaluation of the reflective measurement model consists of a loading factor > 0.70, composite reliability > 0.70, and Average Variance Extracted (AVE > 0.50). Additionally, it includes an assessment of discriminant validity, specifically HTMT (Heterotrait Monotrait Ratio) < 0.90.
a. Variable level convergent validity and reliability
Validity and reliability tests at the variable level involve two main aspects: Convergent Validity and Construct Reliability. Convergent Validity is established when the loading factor value is greater than 0.7, and the Average Variance Extracted (AVE) is higher than 0.5. Additionally, Construct Reliability is confirmed if the composite reliability exceeds 0.7, and the Cronbach alpha is greater than 0.7.

Convergent validity level variables on the variable Waste Management against Climate-Related Diseases
Among the dimensions representing the measurement of the Waste Management variable, the highest loading factor value is observed for the Availability of Waste Management Facilities (X1) dimension at 0.897, while the lowest is found in the Organic Waste Management (X2) dimension, with a loading factor value of 0.827. It's worth noting that each dimension within the waste management variable meets the validity criterion, as all have a loading factor value exceeding 0.7.
Among the measurement dimensions for the climate-induced disease variable (Y), dengue hemorrhagic fever (Y2) stands out with the highest loading factor value of 0.785. This suggests that any variations in the climate-induced disease variable will be more prominently represented in the dengue hemorrhagic fever dimension.
The combined Average Variance Extracted (AVE) value is deemed satisfactory for Convergent Validity, surpassing 0.5. Additionally, the composite reliability and Cronbach's alpha values evaluating the dimensions exceed 0.7. Hence, these results confirm the fulfillment of the reliability criteria at the variable level.
b. Discriminant validity level variable
The square root of the Average Variance Extracted (AVE) for the Waste Management variable is 0.864, surpassing the correlation with climate-induced diseases (-0.581), denoted as 0.864 > -0.581. Similarly, the square root of the Average Variance Extracted (AVE) for the Climate Disease variable is 0.734.
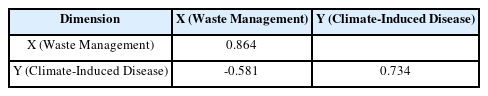
Fornell lacker on the variable Waste Management against Climate Diseases

Cross loading on Waste Management variables on Climate-Related Diseases
The Availability of Facilities (X1) dimension within the waste management variable demonstrates a strong positive correlation (0.897) with the waste management variable it assesses and a negative correlation (-0.546) with the climate-induced disease variable. This same pattern is observed for the other dimensions.

Heterotrait-Monotrait Ratio (HTMT) of variable levels in the variable of Waste Management to climate-induced disease
The table displays Heterotrait-Monotrait Ratio (HTMT) values that are consistently below 0.90, indicating that all variables are theoretically distinct. This distinction has been subjected to statistical testing, and the evaluation of Discriminant Validity using HTMT is deemed acceptable, as the HTMT values for each pair of variables remain below the 0.90 threshold.
2. Evaluation of structural model of the effect of Waste Management on Climate-Related Diseases
The table illustrates the highest outer loading value among the climate-induced disease variables in the Climate Village Program area, which is observed in the Y1 dimension, specifically for diarrhea disease, with a value of 0.826. In contrast, the table shows that the highest outer loading among climate-induced disease variables in non-Climate areas is in the Y2 dimension, specifically for Dengue Fever, with a value of 0.817. This dimension stands out as the most prominent, indicating its significance in measuring climate-induced disease variables.
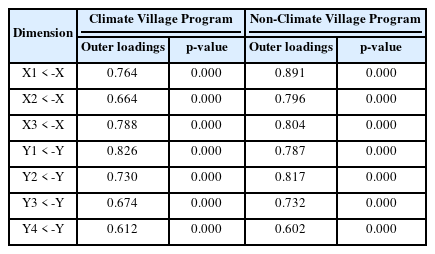
Outer loading value of the effect of Waste Management on Climate-Related Diseases in pro-climate and non-climate areas.

Bootstrapping analysis of the effect of Waste Management on Climate-Related Diseases in Climate Village Program and Non-Climate Village Program Areas.
The table provides path coefficients illustrating the strength of relationships between constructs or latent variables in the model. Based on the results of the bootstrapping analysis conducted in Climate Village Program areas, the p-values for the association between the waste management variable and Climate-Related Diseases demonstrate statistical significance, with a p-value of 0.000 (p < 0.05) and a T-statistic of 5.922 (T > 1.96). The initial sample data reveals a negative relationship, implying that a higher level of waste management is associated with a lower risk of climate-induced disease.
In non-Climate Village Program areas, the analysis reveals significant results for the p-values between the waste management variable and Climate-Related Diseases, with a p-value of 0.000 (p < 0.05) and a T-statistic of 16.414 (T > 1.96). The original sample value indicates a negative relationship, signifying that a higher waste management value is associated with a reduced risk of climate-induced disease.
3. Model quality evaluation
a. R square
According to the table above, it is evident that the impact of waste management on climate-related diseases is 33.7 %, indicating a moderate or significant effect.

R Square on Waste Management variables on Climate-Related Diseases.
b. Q square
The Q square redundancy value above 0 for climate-induced disease variables suggests that the model has predictive relevance. Specifically, the Q square value for climate-induced disease is 0.171, indicating moderate predictive accuracy. This implies that any alteration in each variable will predict changes in satisfaction with a moderate level of accuracy.

Q Square on Waste Management variables on Climate-Related Diseases.
Analyzing the effect of Waste Management on Climate-Related Diseases
The results indicate that waste management significantly and negatively affects Climate-Related Diseases, with a p-value of 0.000 in both Climate Village Program areas and Non-Climate Village Program areas, as well as a negative sample originality. This implies that as the level of waste management improves, the occurrence of Climate-Related Diseases decreases. In simpler terms, effective waste management is linked to a reduced risk of Climate-Related Diseases.
Waste management is part of climate change mitigation actions in Climate Village Program areas. According to the Climate Village Program Practical Book issued by the Ministry of Environment and Forestry, climate change mitigation comprises a series of activities aimed at reducing greenhouse gas emissions as an effort to mitigate the impacts of climate change. [4] The activity options for mitigating climate change include waste and solid waste management actions. There are four types of actions: having proper trash bins, providing temporary shelter, avoiding burning, implementing waste processing, utilizing or extending the lifespan of goods, and harnessing methane gas from organic waste as an energy source.
The most substantial loading factor for the waste management variable is the indicator of the availability of waste management facilities, with values of 0.764 in the Climate Village Program areas and 0.891 in the Non-Climate Village Program areas. This variable's availability of waste management facilities includes statements pertaining to the presence of temporary shelters and waste banks in the respondent's neighborhood. The presence of temporary shelter significantly influences the behavior of individuals concerned about their environment. The absence or inadequacy of temporary shelter can result in deviant community behavior, such as littering in rivers. These deviant community actions can have an impact on public health quality. [9] A polluted environment can attract disease vectors like mosquitoes and flies, leading to the transmission of diseases such as dengue fever and diarrhea. Another study conducted by Hamzah (2012) established a noteworthy correlation between the availability of temporary shelter and the incidence of diarrhea in toddlers. [10]
e presence of waste banks significantly influences community engagement in waste management [11]. The research findings indicate that the introduction of waste banks leads to an increase in community participation, with individuals actively contributing to environmental protection through waste segregation and collection. Active community participation in waste sorting significantly reduces the amount of waste sent to landfills. As a result, it eases the overall management workload and helps mitigate detrimental environmental impacts, including waste accumulation and soil and water pollution [12].
The second-largest loading factor for the waste management variable is related to the non-organic waste indicator, with values of 0.788 in Climate Village Program areas and 0.804 in Non-Climate Village Program areas. This indicator includes statements on sorting, collection, transportation, and recycling. Descriptive analysis results for non-organic waste management indicators indicate predominantly high values in Climate Village Program areas and moderately average values in Non-Climate Village Program areas.
This corresponds with the observation that certain communities within the Climate Village Program area actively engage in waste sorting and collection, depositing it in waste banks managed by each neighborhood association. Communities outside the Climate Village Program adopt a similar practice, although some areas lack waste bank facilities. As a result, various waste management approaches are employed, such as sorting and selling to individual waste collectors, handing waste over to garbage collectors every two weeks, and burning waste in front yards. The practice of burning waste involves waiting for sufficient accumulation before disposal. If garbage is left exposed to rain, the waiting period creates conditions conducive to mosquito egg laying. If not processed within 12 days, these mosquito eggs will hatch into adult mosquitoes, contributing to an increase in the mosquito population. [13]
The organic waste indicator has the lowest loading factor among the waste management variables, with values of 0.664 in the Climate Village Program areas and 0.796 in the Non-Climate Village Program areas. This indicator encompasses statements related to segregating organic and non-organic waste, as well as the processing of organic waste into compost. In a study conducted by Martiani, Jaksa, Ernyasih, and Andriyani in 2023, it was found that waste management significantly and negatively affects the likelihood of falling ill [14]. Inadequate waste management can contribute to diseases like Dengue Hemorrhagic Fever (DHF) because poorly managed waste can collect water and create breeding sites for the Aedes aegypti mosquito, resulting in an elevated risk of mosquito-borne diseases [15]. The connection between waste management and the presence of mosquito larvae is clear. If a temporary waste disposal site lacks proper segregation between biodegradable and non-degradable waste and becomes a repository for various waste items, it can serve as a breeding ground for mosquitoes.
Poor waste management practices are more likely to result in diarrhea compared to proper waste management. This is because risky waste management practices create environments that encourage animals and insects (vectors) to act as disease-transmitting agents, which can lead to the occurrence of diarrhea. Waste management is closely connected to public health, as waste can harbor disease-causing microorganisms and provide habitats for insects that transmit or cause diseases. This is consistent with the findings of Lailatul's 2013 research, which establishes a link between waste and the occurrence of diarrhea [16]. Therefore, it is crucial for waste and its management to comply with health standards to prevent them from serving as breeding grounds for insects that function as disease vectors.
Conclusions
The findings indicate a significant negative relationship between waste management and Climate-Related Diseases, as evidenced by negative sample originality. In simpler terms, increased levels of waste management are associated with a reduced occurrence of Climate-Related Diseases.
Acknowledgements
The authors would like to sincerely thank everyone who participated in the study. This article and the research were made possible only through the extraordinary assistance of each participant in the study.
Notes
The writers declare that they are not associated with or involved in any group or entity that has a financial or non-financial stake in the topics or resources covered in this publication.
CRediT author statement
RA: Conceptualization, Methodology, Software; AFHM: Supervision, Writing- Reviewing and Editing; LS: Supervision, Writing- Reviewing and Editing; SAM: Data curation, Writing- Original draft preparation; NDA: Visualization, Investigation; AR: Data curation, Writing- Original draft preparation.