Effects of the 2018 heat wave on health in the elderly: implications for adaptation strategies to climate change
Article information

Abstract
There has been growing concern over the effects of heat waves on health. However, the effects of heat waves on the health of individuals in vulnerable groups have rarely been examined. We aimed to investigate the acute health effects of heat waves in elderly individuals living in rural areas and to survey their adaptation capacity. Repeated measurements of body temperature (BT), blood pressure, sleep disturbance, and indoor temperature were conducted up to six times for each of 104 elderly individuals living in rural areas of South Korea during the 2018 heat wave. Changes in BT, systolic blood pressure (SBP), and diastolic blood pressure (DBP) according to variations in indoor and outdoor temperature were analyzed using linear mixed effect models controlling for age, sex, smoking, and drug use. We also surveyed heat wave adaptation capacity, heat wave shelters, and self-reported health problems. The average indoor temperature measured during the study period was 30.5°C (range: 22.9–38.3°C) and that of ambient temperature was 30.6°C (range: 24.6–36.3°C). BT significantly increased with indoor and outdoor temperatures. The effect on BT was greater in elderly women and the elderly with hypertension. DBP generally decreased with increasing indoor temperature, though the correlation was only statistically significant among the elderly with hypertension. Only 22 (21.2%) individuals used air conditioners during the heat wave. Most did not use an air conditioner mainly to avoid high electricity costs. Of the participants, 58.7% reported experiencing sleep disturbance, which was the most frequent self-reported health problem. Elderly individuals living in rural areas are directly exposed to high temperatures during heat waves, and their vital signs are sensitive to increases in indoor temperature due to poor adaptation capacity. Well-designed strategies for alleviating health-related stress during heat waves are necessary.
Introduction
The average surface temperature of the earth in 2018 was the fourth highest in the 140 years for which records have been kept [1]. Throughout the summer of 2018, a record-breaking heat wave called the 2018 Northeast Asia heat wave affected large areas of the Korean peninsula, China, and Japan. According to an official report by the Korean government [2], the average number of heat wave days throughout South Korea during this period was 31.4 days, the highest since 1907 when official meteorological measurement started, and this broke the previous record of 31.1 days, set in 1994. The maximum temperature of Hongcheon, Gangwon Province, South Korea on August 1, 2018 was 41.0°C, which also broke the previous measurement record. During this unprecedented heat wave, 48 people died of heat stroke and 4,526 were taken to the hospital for heat-related conditions [2]. The intensity and frequency of heat waves have been increasing in summer, and the frequency, intensity, and duration of heat waves are expected to continue increasing due to climate change [3]. Concerns have thus been mounting over heat-related health problems [4–7].
Elderly people often have chronic diseases, such as cardiovascular, respiratory, and renal diseases as well as diabetes, which can be affected by heat and are thus areas of concern in relation to the health impacts of climate change [7–9]. In particular, elderly individuals with low socioeconomic status represent one of the groups that are most vulnerable to heat waves because they may lack the appropriate adaptation capacity [10].
Few studies have investigated the health impacts of heat wave exposure in the elderly with low income and poor residential environments. Kim et al. examined the acute effects of heat stress on health indicators in elderly individuals living in doss houses in South Korea [10]. They revealed that poor older adults were directly exposed to heat stress during heat waves and their vital signs were sensitive to increases in indoor temperature. However, the study focused on elderly individuals living in an urban area. No study has yet investigated the exposure levels and effects of heat waves in an elderly population in rural areas. To construct substantial heat wave adaptation strategies, more studies on the health impacts of climate change on vulnerable groups are required, in particular studies that consider diverse environmental conditions. The impact of increasing heat waves on human health can then be minimized based on the evidence.
In the present study, we aimed to investigate the effects of heat waves on elderly individuals’ health and residential environment. We used the 2018 heat wave in Korea to provide basic evidence for prevention strategies with respect to future heat waves. To achieve our goals, first, exposure to the heat wave among elderly individuals living in rural areas, including individuals with low socioeconomic status, was assessed by measuring indoor temperature during the heat wave. Second, the effects of the heat wave on health indicators including self-reported symptoms were estimated. Lastly, adaptation capacity and the necessity for the elderly to avoid the effects of heat wave exposure were surveyed to prioritize strategies for improving the adaptation capacity of vulnerable people to climate change.
Materials and Methods
Study design and participants
This study consisted of three parts: 1) assessment of exposure to high temperatures among a susceptible group, namely, the elderly living in rural areas during the 2018 heat wave, 2) assessment of the health effects of the heat wave, including subjective and objective health outcomes, based on repeated measurements of indoor temperature and health indicators, and 3) assessment of the availability and efficacy of government programs, such as heat wave shelters.
We recruited a panel of 104 elderly individuals aged 65 years and older living in the following rural areas in southern South Korea: Gijang, Busan (29 persons); Imsil, Jeollabuk-do (25 persons); Gwangyang, Jeollanam-do (24 persons); and Namhae, Gyeongsangnam-do (26 persons) (see Figure 1 for the location of the study areas). Gijang is included in Busan Metropolitan City. However, the study area, Jeonggwan-eup, Gijang-gun, located in the northernmost part of Busan Metropolitan City, with a population of 82,000 people, is a mixed urban and rural area and retains many characteristics of a rural area. We selected these areas because they have high incidences of hyperthermia during the summer [11] and are generally expected to be exposed to higher temperatures than other northern areas, owing to their lower latitudes.
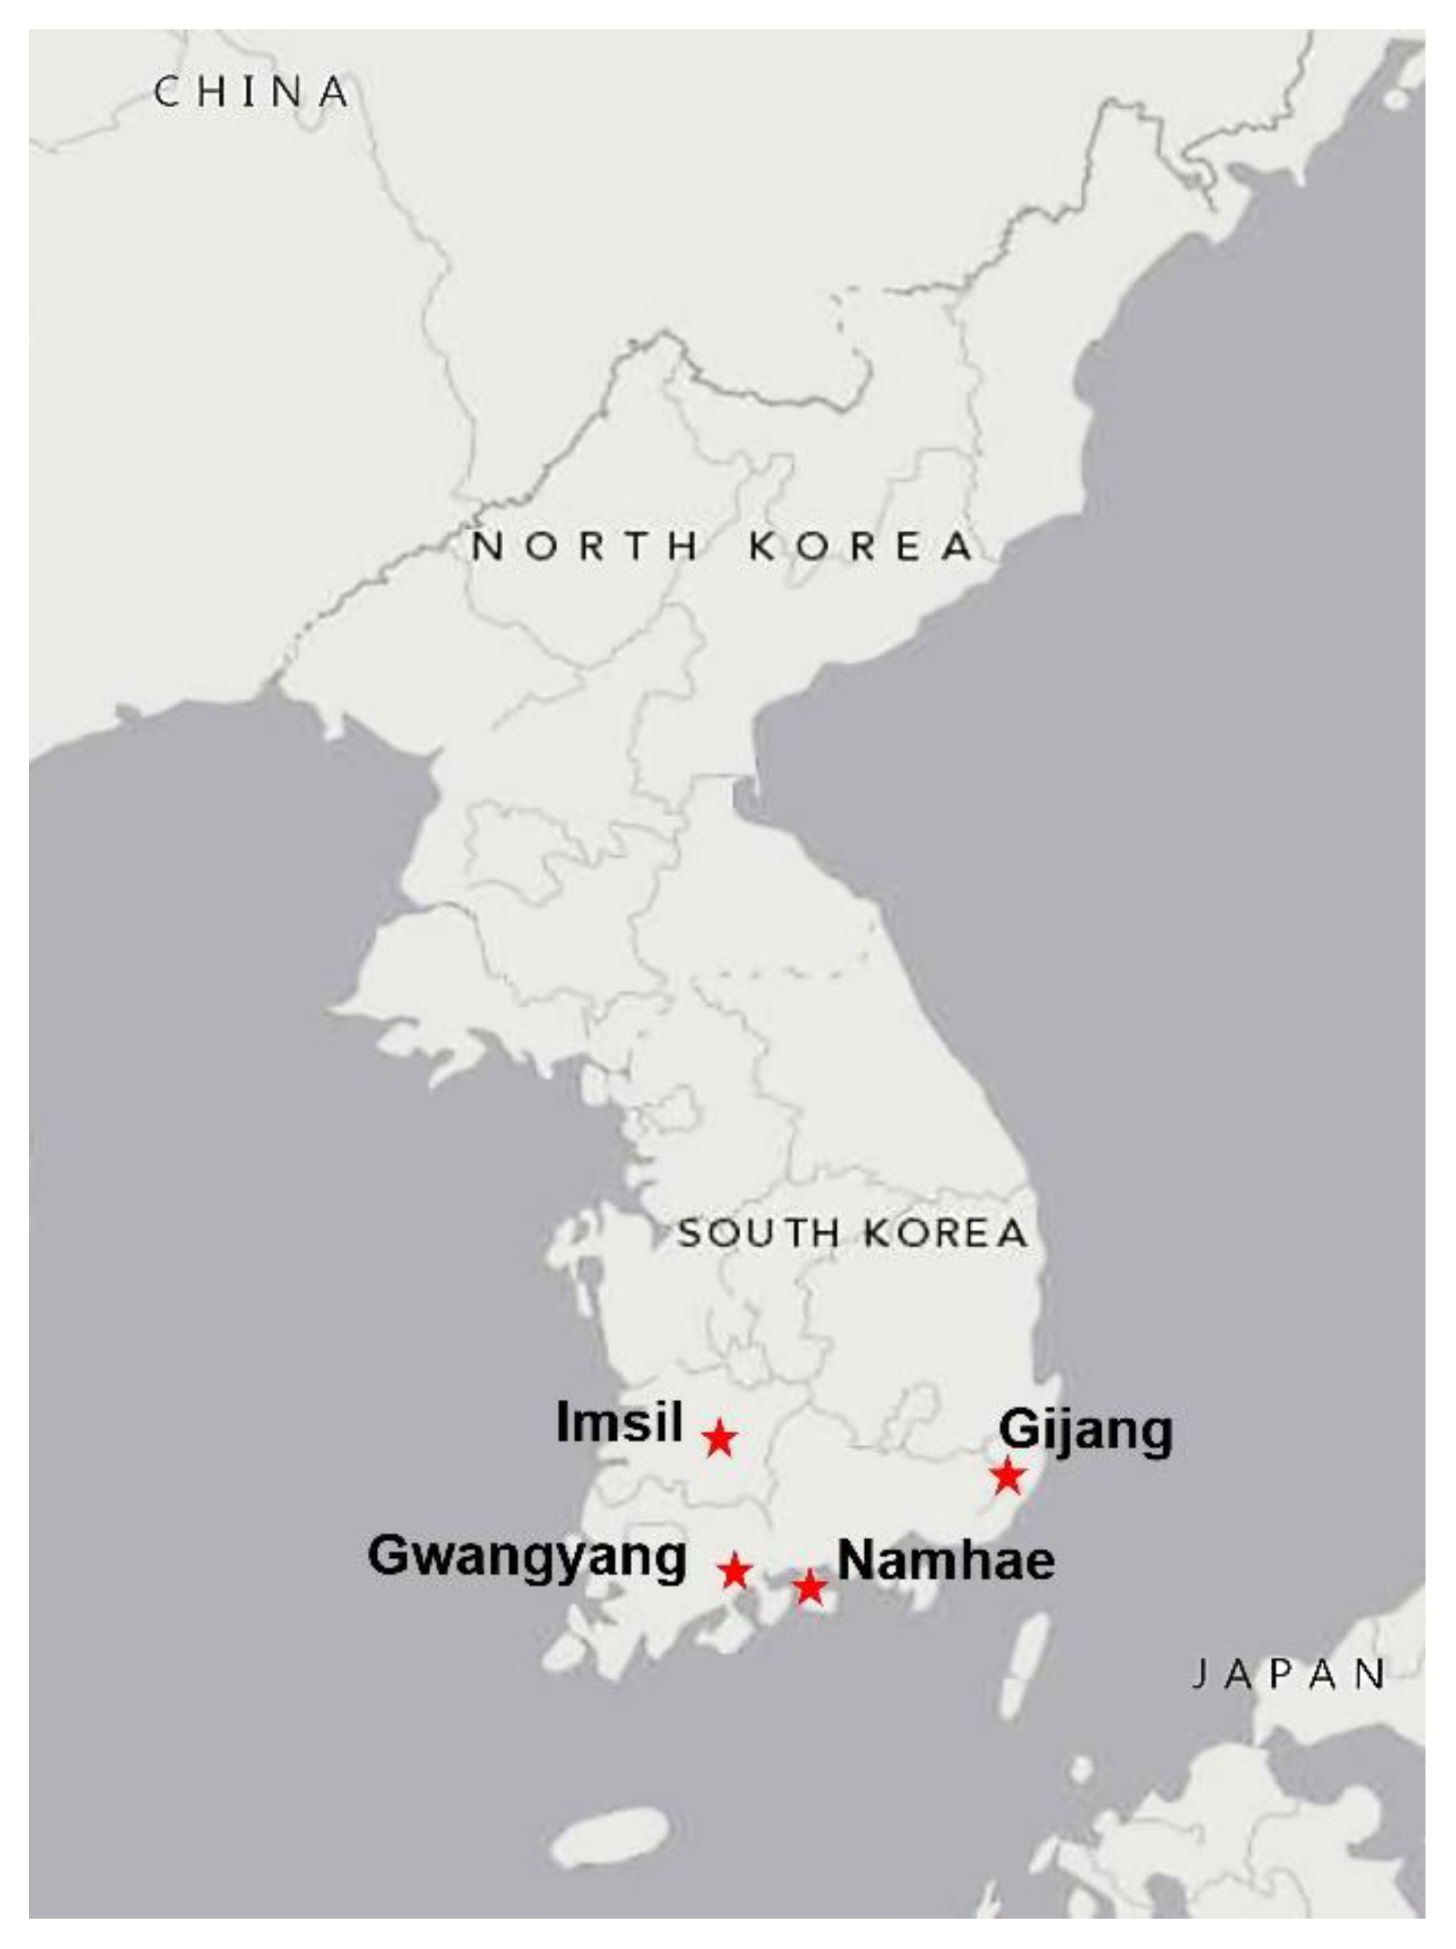
Locations of four study sites (the red star symbol indicates study sites)
We conducted a questionnaire survey on the demographic characteristics, socioeconomic status (e.g., income), health conditions, residential environments, use of air conditioners, and behavioral response to hot temperature events of the participants to determine their adaptation capacity and susceptibility to a heat wave. To assess the government heat wave programs, the participants were also asked whether they were aware of the heat wave policy and whether they were satisfied with the policy.
The data collection and survey were conducted by trained investigators who were informed about the measurement protocol. All the participants gave written informed consent before they participated in the study.
Exposure assessment to high temperature
Repeated measurements of the indoor temperature and relative humidity (RH) of the residences of the study subjects were conducted from August 1 to 19, 2018 using an electronic hygrothermograph (AE-817CE, B&J, Zhejiang, China). During the 19-day study period, there were 14 heat wave days in Gijang and Imsil, and 12 in Gwangyang and Namhae.
Before measurement, we calibrated all 104 thermometers and hygrometers to reduce variations between devices. Details of the calibration process are given in our previous study [10]. The thermometers and hygrometers for every household were installed in such a manner as to avoid particular heat sources. Indoor temperature and RH were measured twice a day (morning and afternoon), and each house was visited for three days during the study period, accounting for six repeated measurements for each participant. Ambient temperature, hourly temperature and RH data for the study period were retrieved from the Korea Meteorological Administration website. We collected the meteorological data from the monitoring sites nearest to each study area. The ambient temperature and RH data for participants living in a study area were taken from the same monitoring station because there is one station for each study area. The average values between 9 AM through 12 PM were utilized as the morning data for ambient temperature and RH for each study area, and those for 1 PM through 5 PM were used as afternoon data.
Health outcomes
We conducted objective and subjective measurements of health outcomes. The objective measurements consisted of health indicators, including body temperature (BT), systolic blood pressure (SBP), and diastolic blood pressure DBP. BT, SBP, and DBP were measured twice (morning and afternoon) per day on the same three days as the exposure measurements. After ten minutes of rest, seated blood pressures were measured twice at 10-minute intervals, and then the average of the two blood pressure measurements was used in the analyses. Blood pressure measurements on the right arm were recorded using an electronic sphygmomanometer (Omron HEM-7320, Omron, Tokyo, Japan). BT was also measured twice (once from the forehead and once from behind the ear) using an infrared forehead thermometer (HuBDIC FS-700 Thermofinder-S, HuBDIC, Anyang, Korea), and the average of the two measurements was used. Self-reported number of hours of sleep during the prior night was recorded every morning when the investigators visited as a subjective health outcome.
Heat wave response
To elucidate the heat wave adaptation capacity and the effectiveness of the heat wave policy for vulnerable groups, heat wave response behaviors and satisfaction with the Korean government’s heat wave shelter program were surveyed using a questionnaire. All answers to the questionnaires were recorded by trained investigators, following an interviewer survey methodology. The contents of the questionnaire are given in Table 1.

Content of the questionnaire for the assessment of response behavior and adaptation capacity to heat waves
Statistical analyses
Considering the repeated measurements of the variables, linear mixed effect (LME) models were used to estimate the association between high temperature exposure and health outcomes. Age, sex, indoor RH, smoking, and the use of anti-hypertensive medication were adjusted in the model owing to their known relation to blood pressure. We stratified the participants by sex and presence of hypertension and then compared the effects of high indoor temperature on the health outcomes between the subgroups. We followed previous studies which showed that the effects of thermal stress differed with sex [12] and presence of hypertension [10]. The basic model specifications are as follows:
where E(Y) is the expected expression of BT, DBP, SBP, and number of hours of sleep; Temp refers to indoor temperature; CFi indicates the confounding factors, including age, sex, smoking, and indoor RH; and γ denotes the random effect for each subject. For blood pressure, the use of antihypertensive medication was included in the model as a confounding factor. For number of hours of sleep, we matched the self-reported sleep records with the previous day’s indoor temperature.
All analyses were conducted using R version 3.2.2 (The Comprehensive R Archive Network: http://cran.r-project.org) using the “lme4” package (version 3.2.3) for LME model fitting. All tests used two-sided p-value which less than 0.05 was considered significant.
Results
Summary of subjects
A total of 104 elderly people (29 men and 75 women) with a mean age of 79.6 years (range: 65–96 years) were included in this study. A summary of the participants’ characteristics is given in Table 2. Among the participants, 86 (82.7%) were classified as low-income (less than KRW 500,000 per month) and 68 (65.4%) lived alone. Most had one or more chronic diseases, such as hypertension and arthritis. Of the 104 participants, 93 (89.4%) lived in houses and 5 (4.8%) lived in apartments or multi-family houses. Most houses (61.9%) were very old (30 or more years old), and about 31.4% of the houses had slate roofs.

Participants’ characteristics (N=104)
Temperature exposure and health outcome measurements
A total of 624 measurements (6 per participant) were collected for indoor temperature and health indicators. The average indoor temperature measured during the study period was 30.5°C (range: 22.9–38.3°C), whereas the average ambient temperature was 30.6°C (range: 24.6–36.3°C) (Table 3). Overall, no differences were observed between the mean indoor and outdoor temperatures (p-value=0.9736). The maximum value of temperature was recorded for indoor temperature. Indoor temperatures in the morning (29.6°C; range: 24.2–38.3°C) were slightly higher than outdoor temperatures (29.1°C; range: 24.6–31.7°C) (p-value=0.0002), whereas afternoon indoor temperatures (31.3°C; range: 22.9–37.3°C) were slightly lower than outdoor temperatures (32.0°C; range: 26.9–36.3°C) (p-value=0.0001), as shown in Figure 2. The average BT was 36.8°C (standard deviation [SD]=0.4°C), and the average SBP and DBP were 131.6 mmHg (SD=18.8 mmHg) and 76.3 mmHg (SD=10.4 mmHg), respectively (Table 3). The average number of hours of sleep for 265 person-days was 6.2 (SD=1.7 hours) and 32.8% (87 person-days) fell below 6 hours.

Summary statistics of measurements
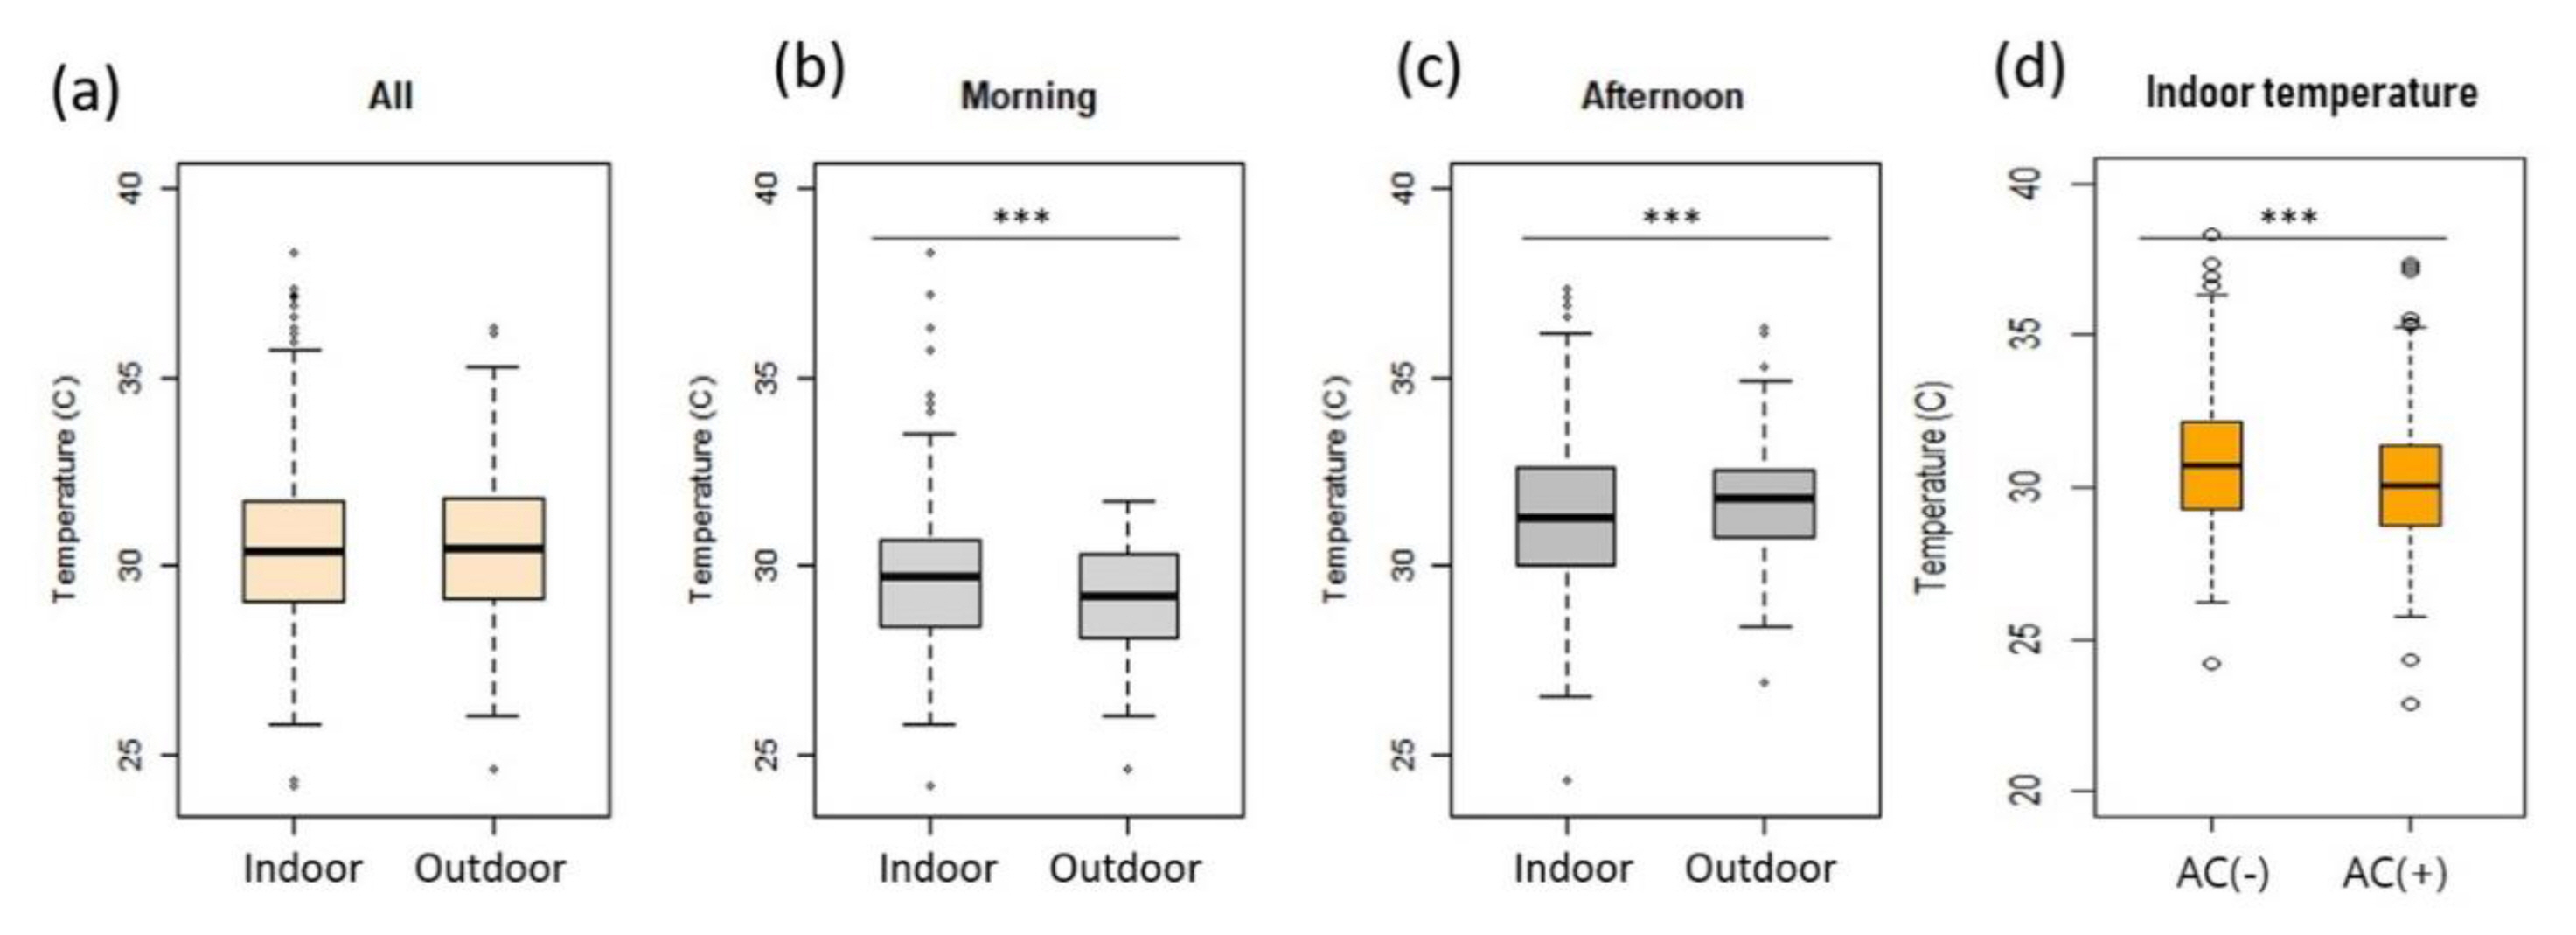
Comparison between indoor and outdoor temperatures (a~c) and of indoor temperatures between houses with and without an air conditioner (d).
***mean differences are statistically significant with p <0.001
Among the 104 houses, 51 (49.0%) had air conditioners. The indoor temperature of houses without air conditioners (31.0°C; range: 24.5–38.5°C) was higher than that of houses with air conditioners (30.2°C; range: 22.9–37.6°C) (p-value < 0.0001) (Table 4). However, the indoor temperatures of houses with air conditioners were still very high. The SBP and DBP of houses without air conditioners were slightly lower than those of houses with air conditioners, whereas there was no difference in BT between the two, as shown in Table 4. Most participants (89.4%) lived in houses, while a few (4.8%) lived in apartments; there was no significant difference in indoor temperature between houses (30.6°C; range: 22.9–38.5°C) and apartments or multi-family houses (30.9°C; range: 27.5–35.1°C) (p-value=0.2608).
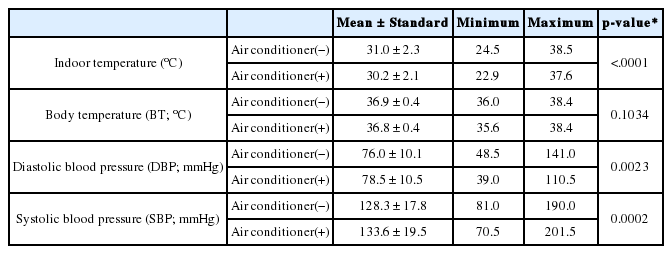
Comparison of indoor temperature and health indicators between houses with and without air conditioner
Effects of high temperature on health indicators
The effects of temperature on BT, DBP, and SBP are given in Table 5. BT increased by 0.05°C [95% confidence interval (CI): 0.04–0.07°C] and 0.02°C (95% CI: 0.01–0.03°C) as indoor and outdoor temperature increased by 1°C, respectively, with adjustment for age, sex, and RH. The effects of the increase in indoor temperature on BT were greater in the elderly with hypertension than those without hypertension and in elderly women than men. The effect of outdoor temperature was also greater in women. However, the effect of outdoor temperature on BT did not differ between participants with and without hypertension. Furthermore, in contrast to the effect of indoor temperature, the effect of outdoor temperature was not statistically significant.

Effects of temperature on health indicators in elderly during heat wave
DBP generally decreased with increases in both indoor and outdoor temperatures. However, only the effect of indoor temperature on DBP of the elderly with hypertension was significant. With a 1°C increase in indoor temperature, DBP of the elderly with hypertension decreased by 0.44 mmHg (95% CI: 0.04–0.84 mmHg). The association between indoor temperature and SBP was positive but not significant.
Questionnaire survey results
As shown in Table 6, among 104 participants, only 22 (21.2%) reported using air conditioners during the heat wave, even though 55 participants had air conditioners. The most frequent reason for not using the air conditioner was the high price of electricity. Among 56 elderly people who did not use an air conditioner or electric fan, 38 (67.9%) reported that their lack of use was because of the high cost of electricity. Furthermore, 71 (68.3%) reported that electricity costs were burdensome to them in their everyday lives.

Response behavior and adaptation capacity to heat waves
Meanwhile, 66 (63.5%) participants indicated being aware of the existence of heat wave shelters, and 29 (27.9%) had been to a heat wave shelter during a heat wave. Among 81 respondents who answered to the question, “Have you ever felt that heat wave shelters were helpful during heat waves?”, 48 (59.3%) reported that a heat wave shelter was helpful. When the participants were asked for suggestions for improvement, the following points were identified: accessibility [21 (28.0%)], convenience [13 (17.3%)], and extension of running time [11 (14.7%)]. When the participants were asked what would be required to adapt to heat waves, the most frequent response was a drinking water supply and adequate nutrition [34 (32.7%)], followed by health care services including visiting nurses [16 (15.4%)] and improvements of residential environments [15 (14.4%)] (data not shown).
During heat waves, the respondents reported experiencing dizziness [56 (53.8%)], hyperhidrosis [49 (47.1%)], fatigue [35 (33.7%)], headache [33 (31.7%)], and dyspnea [27 (26.0%)]. Edema, motion disorder, nausea, and fainting were also experienced by 15.4%, 12.5%, 10.6%, and 2.9% of participants, respectively. In addition, 58.7% of the participants stated they had experienced sleep disturbance because of heat waves. When asked how many hours per night they slept in the last week, they answered 5.9 hours (SD=1.8 hours) on average. The average number of hours of sleep during heat waves was lower than usual [6.6 hours (SD=1.5 hours)].
Discussion
The present study shows that the 2018 heat wave in Korea affected the health indicators of elderly individuals living in rural areas, mainly because of unhealthy residential environments and a lack of adaptation capacity. This study is the first to examine the effects of a heat wave on health indicators in the elderly living in rural areas by measuring indoor temperatures during heat waves. Although Zeng et al. and Revich et al. studied the health effects of heat waves and included data from rural areas, those studies analyzed the effects of heat waves on mortality, not on disease states or health indicators [13,14]. Our results are similar to those of our previous study which revealed the adverse health effects of heat waves on the elderly living in low-cost dosshouses in Seoul, South Korea, during hot summer days in 2010 [10]. Although the ambient temperature during the study period was higher in this study [30.6°C; range: 24.6–36.3°C] than in the previous study [28.2°C; range: 25.6–32.1°C], the effect of a 1°C increase in indoor temperature on BT in the present study [0.05°C; 95% CI: 0.04–0.07°C] was lower than that in the previous study [0.21°C; 95% CI: 0.16–0.26°C] [10]. These results reflect a relatively low indoor temperature [30.5°C; range: 22.9–38.3°C] and average blood pressure in the present study (Table 3) compared to the previous study. In the previous study, the average indoor temperature was 31.5°C (range: 29.1–34.8°C) and average SBP and DBP were 133.7 mmHg (range: 88.0–205.0 mmHg) and 81.7 mmHg (range: 50.0–170.0 mmHg), respectively. It is well known that dehydration, salt depletion, and increased surface blood circulation during hot summer days can impair thermoregulation and lead to an increase in BT [15–17]. Therefore, an increase in BT in the elderly may be a risk factor that aggravates cardiovascular, cerebrovascular, and respiratory diseases [18]. In this study, the effects of increasing temperature on BT were greater in elderly women than in elderly men. This might be attributable to the higher prevalence of chronic diseases in women than men; the prevalence of hypertension in women was 61.3%, while that in men was 48.3%. The rates of obesity and hyperlipidemia were 5.3% and 9.3% in women, respectively, and 0.0% and 3.4% in men. These results support the notion that the relationship between high temperature and mortality is modified by gender; the effect estimated among women was 20 times greater than that among men [12]. Other unknown factors may also have contributed to the observed difference between men and women.
Although the effect of high indoor temperatures on number of hours of sleep on a daily basis was not statistically significant (Table 5), more than half (58.7%) of participants reported experiencing sleep disturbances during heat waves. These results coincide with those of a previous study that investigated the association between indoor temperature during summer and sleep disturbances in elderly people [19], which found that 40.6% of participants experienced sleep disturbances during hot summer days. According to Murage et al., nighttime exposures additionally contribute to heat-related mortality, and the impact is most pronounced on warm nights after a hot day [20]. Thus, the government should implement more practical policy measure to prevent sleep disturbances in the poor and elderly, especially on tropical nights. For example, an extension of the operating times of heat wave shelters through the night is recommended.
Our results showed that changes in health indicators in the elderly during the heat wave were more strongly related with indoor temperature than outdoor temperature, which is in line with the findings of a previous study [19]. Increases in annoyance due to heat and sleep disturbance were associated with indoor temperature more strongly than outdoor temperature. These results imply that vulnerable groups or those with a lower socioeconomic status cannot avoid heat exposure, even indoors, during heat waves. Accordingly, our results indicated that indoor temperatures for lower income groups and for houses without air conditioners were higher than those of higher income groups and houses with air conditioners. According to the household energy standing survey in South Korea [21], the average presence of air conditioners in South Korea was 71% in 2016, whereas it was 49.0% in our sample. The average daily duration of use of air conditioners in main South Korean cities during the 2018 heat wave was 7.7 hours [22], whereas that for the sample in this study was 3.7 hours. These discrepancies may explain the exceedingly high indoor temperatures of houses with air conditioners. The elderly in this study did not use air conditioners long enough to maintain a comfortable room temperature, reflecting their lower incomes and poor adaptation capacity (Table 2).
The participants stated that the main reason that they did not use cooling devices was the high price of electricity. Among the participants, 68.3% reported that cooling-related electricity costs were burdensome to their household, leading them not to use their air conditioners even on extremely hot summer days. As the only way to prevent heat-related health impacts is to avoid heat exposure and to keep BT in the normal range, it is necessary to reduce the cost of using cooling devices. Practical strategies supporting electricity costs for the operation of cooling devices during heat waves are necessary for groups vulnerable to heat stress.
One of the strengths of this study is that repeated measurements of indoor temperature and health indicators during the 2018 heat wave were used, which reveal heat exposure and the effects of the heat wave in a highly vulnerable group. One limitation of this study is that our health measurements were taken on just three days for each individual. During the 2018 heat wave in South Korea, the station-averaged number of heat wave days, defined as more than two consecutive days with a maximum temperature more than 33°C, was 31.4, and the average number of tropical nights was 17.7 [2]. Assessments of the long-term health effects of heat waves based on continuous measurements are required. The measurements of hours of sleep in this study was based on self-reports, which is another limitation of this study. A sensor-based measurement of the hours of sleep would be more useful to assess the effects of heat waves.
In conclusion, elderly individuals living in rural areas are directly exposed to high temperatures during heat waves, and their vital signs respond sensitively to temperature increases. Notably, the impact of heat exposure was higher in elderly women than men. We found that low-income elderly individuals who live in rural areas seldom use their air conditioners, mainly because of the high price of electricity. The health burden from heat waves is expected to increase with climate change over the coming decades. More substantial strategies to cope with the increasing frequency and intensity of heat waves are, therefore, required, particularly for low-income elderly people.
Acknowledgement
The authors thank investigators from four regional offices for Korea Climate & Environment Network especially for their hard fieldwork during the heat waves.
Notes
Conflict of interest
The authors have no conflict of interest to declare on this study.
CRediT author statement
SK: Conceptualization, Methodology, Writing-Original draft preparation; SYK: Data curation, Investigation; JO: Data curation, Investigation; YC: Conceptualization, Funding acquisition; JP: Methodology, Data curation, Investigation; DK: Investigation, Data curation; YMK: Conceptualization, Methodology, Visualization, Supervision, Data curation, Writing-Reviewing and Editing