Korean research project on the integrated exposure assessment of hazardous substances for food safety
Article information
Abstract
Objectives:
This survey was designed to conduct the first nationwide dietary exposure assessment on hazardous substances including the intakes of functional food and herbal medicine. In this paper, we introduced the survey design and the results of the dietary exposure status and internal exposure levels of lead (Pb), cadmium (Cd), and mercury (Hg).
Methods:
We selected 4867 subjects of all ages throughout Korea. We conducted a food survey, dietary survey, biomonitoring, and health survey.
Results:
Pb and Cd were the highest (median value) in the seaweed (94.2 μg/kg for Pb; 594 μg/kg for Cd), and Hg was the highest in the fish (46.4 μg/kg). The dietary exposure level (median value) of Pb was 0.14 μg/kg body weight (bw)/d, 0.18 μg/kg bw/d for Cd, and 0.07 μg/kg bw/d for Hg. Those with a blood Pb level of less than 5.00 μg/dL (US Centers for Disease Control and Prevention, reference value for those 1 to 5 years of age) were 99.0% of all the subjects. Those with a blood Cd level with less than 0.30 μg/L (German Federal Environmental Agency, reference value for non-smoking children) were 24.5%. For those with a blood Hg level with less than 5.00 μg/L (human biomonitoring I, references value for children and adults, German Federal Environmental Agency) was 81.0 % of all the subjects.
Conclusions:
The main dietary exposure of heavy metals occurs through food consumed in a large quantity and high frequency. The blood Hg level and dietary exposure level of Hg were both higher than those in the European Union.
Introduction
In the modern industrialized world, it is a major public health challenge to prevent health risks caused by exposure to hazardous substances. There are various routes of exposure to hazardous substances: air inhalation, food ingestion, and skin contact. Improved living standards with rapid industrialization have increased interest in a healthy life and food safety and increased consumption of functional foods and herbal medicines [1,2].
With the exception of occupational exposure, exposure to hazardous substances comes mainly from food [3-8]. Much data are needed to systematically assess and control the intake of hazardous substances and their health impact. The exposure to hazardous substances from food, herbal medicines, and functional food should be identified clearly.
The Korean Research Project on the Integrated Exposure Assessment of Hazardous Substances for Food Safety (KRIEFS) was initiated by the National Institute of Food and Drug Safety Evaluation in 2010. KRIEFS was the first survey in Korea to conduct a nationwide integrated dietary exposure assessment on hazardous substances in people of all ages. Before this survey, there were two main surveys available for the analysis of the exposure to hazardous substances in the general population: the Korea National Health and Nutrition Examination Survey (KNHANES) and the Korean National Environmental Health Survey (KNEHS). KNHANES, organized by the Korea Centers for Disease Control and Prevention, has conducted regular investigations to assess the health and nutritional status of the Korean population since 1998. The health and nutrition survey consists of a health examination and interview, biomonitoring, and a nutritional interview [9-12].
KNEHS was designed to measure environmental pollutants in the human body in the Korean population, and it has been conducted since 2005 by the National Institute of Environmental Research in Korea [13]. The environmental pollutants survey consists of biomonitoring and questionnaire-based interviews. KNHANES and KNEHS provide the exposure levels of the general population to hazardous substances. However, KNHANES and KNEHS do not provide information to estimate the dietary exposure to hazardous substances and their health impacts. KNHANES provides reference data for nutrition, but a food contaminant survey has not been conducted. KNEHS evaluates the environmental exposure status and the contribution of various environmental exposure pathways, but the dietary exposure survey is conducted through just a brief food frequency questionnaire (FFQ). Additionally, the survey subjects were all over 20 years of age and did not cover the general population.
The present survey was performed to conduct an integrated dietary exposure assessment (including food, functional food, and herbal medicine) on hazardous substances, estimate the correlations between dietary exposure and internal exposure, and assess the health impacts of dietary exposure to hazardous substances. In this paper, we introduce the survey design and the results of the dietary exposure status and internal exposure levels of lead (Pb), cadmium (Cd), and mercury (Hg).
Materials and Methods
Ethics Statement
The study protocol was approved by the ethics committee of Dankook University Hospital (KUHIRB2010-04-0093, DKUHIRB2011-03-0086). Participants provided their written consent to participate in this study. We obtained written consent from the guardians on behalf of the adolescents and children enrolled in this study.
Study Design
We conducted a food survey, dietary survey, biomonitoring, and health survey from 2010 to 2011. The sampling was conducted nationwide with the study subjects comprising all ages. The sampling area was 15 metropolitan areas and provinces, except Jeju-do, Seoul, Gwangju, Busan, Incheon, Daegu, Daejun, Ulsan, Gyeonggi, Gangwon, Chungbuk, Chungnam, Jeonbuk, Jeonnam, Gyeongbuk, and Gyeongnam (Figure 1).
Distribution of 102 sampling sites (filled circle, metropolitan; check pattern circle, urban; dot pattern circle, rural).
The adult subjects were selected through composite sampling methods. The final sampling unit of this survey was household members. In the first step of the sampling, we conducted stratified probability sampling by region (15 metropolises and provinces), sex, and age (19 to 29, 30 to 39, 40 to 49, 50 to 59, over 60). The sampling size of stratification was allocated a square root allocation method. Second, we extracted 34 cities and counties (si, gun, and gu) from 15 metropolises and provinces, and then extracted 102 town and township (eup, myon, and dong) clusters from 34 cities and towns. Then we randomly extracted subjects from the clusters using a grid method [14].
The child and adolescent sampling was collected with cluster sampling. Sampling regions were allocated according to 15 metropolises and provinces. Adolescents were recruited from elementary schools, middle schools, and high schools. Children were recruited from kindergartens, health centers, and hospitals. The children’s samples were pair collected with the mothers (whenever possible).
During 2010 and 2011, 4867 subjects were surveyed. Among the total surveyed subjects, 2118 were adults over 19 in age, accounting for 43.5% of the total; 1111 were those aged between 7 and 18, or 22.8% of the total; and 1017 were those between 0 and 6 in age, or 20.9%. There were 621 mothers of children aged between 0 and 6, or 12.8%. Males comprised 2014 of the study population, or 41.4%.
The analyzed hazardous substances were Pb, Cd , Hg, eight phthalate metabolites (mono-benzyl phthalates, mono-n-butyl phthalates, mono-isobutyl phthalates, mono-ethyl phthalates, mono- [2-ethylhexyl” phthalates, mono- [2-ethyl-5-hydroxyhexyl” phthalates, mono- [2-ethyl-5-oxohexyl” phthalates, and mono- isononyl phthalates), bisphenol A (BPA), and aflatoxin. These hazardous substances were selected as priority management for food safety in consideration of the degree of the risks, and probability of exposure.
Food, Functional Food, and Herbal Medicine Survey
The food survey was conducted by market-based food samples purchased from large-scale supermarkets and marketplaces in seven major cities (Seoul, Incheon, Daejeon, Gwangju, Daegu, Busan, and Gangreung). Gangreung is not a major city compared with the other cities, but to include the food in the Gangwon-do area, we selected Gangreung as a representative city of Gangwon-do. At least three brands of food were purchased for each food sample in the Pb, Cd, and Hg analysis. The food sample groups consisted of 109 different types of food that were consumed on a generally frequent basis, as well as largely consumed food, such as grains, vegetables, fruits, mollusks, shellfish, seaweed, bean products, meats, and eggs [15].
For the phthalates, BPA, and aflatoxin analysis, strategically selected food samples that could possibly contain those substances were analyzed (aflatoxin were mainly analyzed in flour and nuts, BPA primarily in canned foods, and phthalates primarily in packaged foods). Herbal medicines and functional food samples were collected from the subjects who were taking them.
Dietary Questionnaire
The dietary exposure survey was conducted through individual dietary intake surveys involving a FFQ and 24-hour recall. The FFQ reflected the long-term dietary exposure levels [16-20]. The 24-hour recall survey identified the present exposure level. To reduce sampling bias, the 24-hour recall survey was conducted for two non-continuous days. The questionnaire consisted of the subjects’ dietary patterns, preferred foods, meal balance, frequency of eating functional food and taking herbal medicine, frequency of eating out, canned food consumption, use of plastic containers, and infant feeding histories of the child subjects.
For the dietary exposure analysis, we analyzed the FFQ and 24-hour recall with 16 food group categories, which were settled by the Korean Nutrition Society in 2005 (cereals, potatoes and starches, sugars and sweeteners, pulses, nuts and seeds, vegetables, mushrooms, fruits, meats, eggs, fish and shellfish, seaweed, milks, oils and fats, beverages, and seasonings) (Table 1) [16].
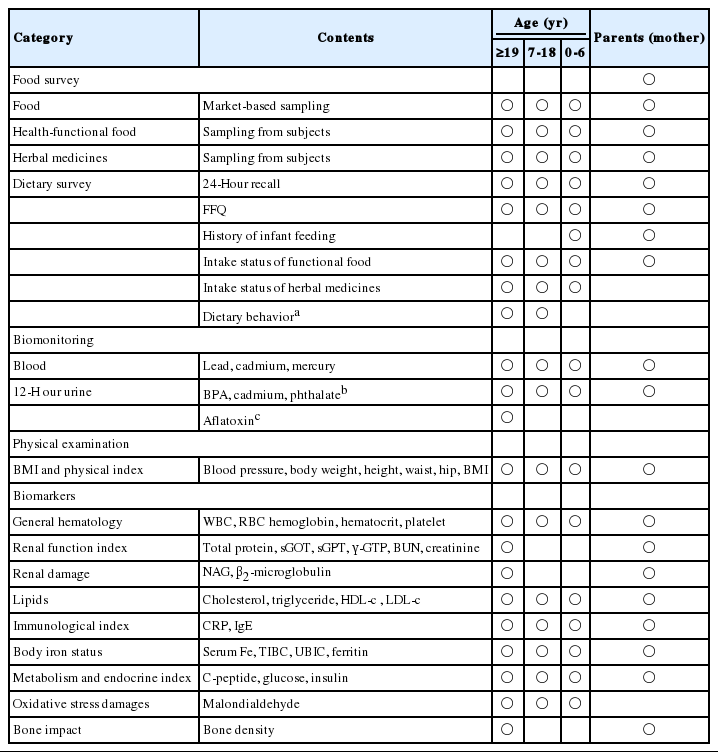
Survey categories and contents of this study
Biological Sample Collection, Processing, and Storage
Depending on the hazardous substances and their metabolism, blood and urine specimens were collected and analyzed to assess internal exposure levels. Pb and Hg were measured in the blood specimens. Cd was measured in both blood and urine specimens. BPA, aflatoxin, and eight phthalate metabolites were measured in 12-hour urine specimens.
A 12-hour urine sample was used to examine the internal exposure level of hazardous substances and metabolism. A 12- hour urine is defined by the urine collected during the time after supper (about 8 pm) on the day before the survey to right before the survey (before 8 am), which includes the day’s first urine. The sampling method of 12-hour urine was to gather all of the urine collected during those 12 hours in plastic cups and put it all in a plastic pack for storage. The urine sample was stored at a cold temperature before removal for the survey.
The biomonitoring process was managed with quality control protocols: a blood collection system (Becton–Dickinson Vacutainertm, Plymouth, UK), blood specimens collected in ethylene diamine acetic acid (EDTA) tubes (5-8 mL), serum separate tubes (5-8 mL), and heavy metal EDTA tubes (1-3 mL). The urine specimens collected were 12-hour urine (urine pack, 86 mL) and spot urine (conical tube, 40 mL). The specimen delivery was conducted in cold storage at 4°C. If the analysis was delayed, we stored the specimens below -20°C until the analysis could be conducted [21].
Health Survey
The health survey included physical index, general hematology, renal function, renal damage, lipids, immunological index, body iron status, metabolism and endocrine index, oxidative stress damage, and bone impact. The renal functional index and bone impact were conducted only on the subjects over 19 years of age. Measurements of blood pressure, β2-microglobulin, immunological index, bone density, malondialdehyde, and immunoglobulin E were analyzed to identify early health impacts of heavy metals. The early health impacts of BPA and phthalates were mainly analyzed using measurements of body mass index, blood pressure, metabolism, and endocrine system (Table 1).
Health Questionnaire
The health questionnaire consisted of demographic characteristics, socioeconomic characteristics, health behavior (smoking, alcohol consumption, and exercise frequency), environmental exposure (indoor and outdoor, residence, and occupational exposure), and drinking water. For subjects over 19 years of age, past medical history and pesticide exposure questionnaire items were included. For subjects 0 to 6 years of age, the questionnaire included breast feeding history, allergies, and family disease history. For subjects 7 to 18 years of age, the International Study of Asthma and Allergic Diseases in Childhood (ISAAC) survey was conducted (Table 2).
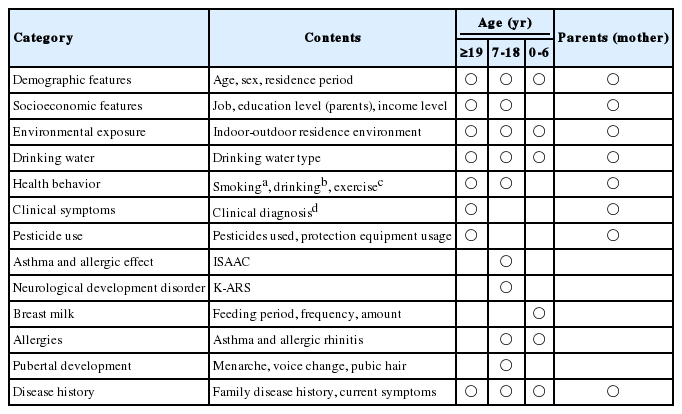
The health questionnaire contents of this study
Field Survey
To conduct the field surveys of children and adolescents, the survey teams visited recruited institutions (kindergartens, health centers, hospitals, and schools). For the adult surveys, we appointed a survey site for each survey region. After confirming the sampling subjects, the survey tools –FFQ and 24-hour recall questionnaires, health questionnaire, plastic packs for 12-hour urine sampling, and glass bottles for herbal medicines and functional food samplings –were distributed to the subjects by postal delivery. The questionnaires were completed by the subjects at home before the interviews (the children’s questionnaires were completed by the mothers). In the field survey, biomonitoring specimens were collected, the health survey was conducted, and the questionnaires were confirmed with a field researcher (Table 3). The second 24-hour recall survey was conducted by telephone within a week after the first survey [16].
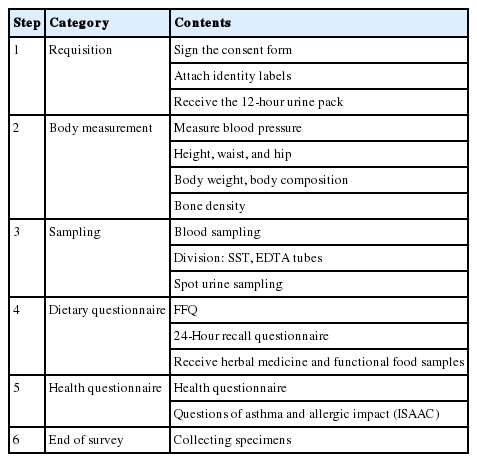
The field survey procedure of this study
Analysis Methods
Pb, Cd, and Hg in foods, functional foods, and herbal medicines were analyzed by the Korean Food Standards CODEX guidelines. Pb and Cd in foods, functional foods, and herbal medicines were analyzed using inductively coupled plasmamass spectrometry (Elan 6100 DRC Plus ICP-MS; Perkin-Elmer Inc., New York, NY, USA). Hg was analyzed with a direct Hg analyzer (DMA-80; Milestone Inc., Sorisolo, Italy) using the gold amalgam method [15].
Before the sample analysis, calibration and optimization were performed. The limit of detection (LOD) for food was 0.20 μg/kg. Pb and Cd in herbal medicines and functional foods were analyzed by standard addition methods. As the dilution size was large, the method detection limit (MDL) value was applied. The MDL for Pb was 5 μg/kg, 8 μg/kg for Cd, and 3.57 μg/kg for Hg [1,22]. To evaluate the reliability of the food, functional foods, and herbal medicines analysis results, National Institute of Standards and Technology (NIST)’s certified reference material (CRM) were analyzed (1566b, 3246, 7402a, 8443). Pb and Cd in blood and urine were analyzed using graphite furnace atomic absorption spectrometry (Pb and Cd in blood: GFAAS, Thermo Inc., Cambridge, UK; Cd in urine: GF-AAS220, Victoria Inc., Varian, Australia). Hg in blood was analyzed with a direct Hg analyzer (DMA-80: Milestone Inc.) using the gold amalgam method. The LOD of Pb in blood and Hg in blood was 0.20 μg/L, the LOD of Cd in blood was 0.10 μg/L, and the LOD of Cd in urine was 0.03 μg/L. NIST’s standard reference material (SRM; 955c level 2 for blood Pb, Cd, and Hg) and the Bio-Rad Co. (Bio-Rad level 1 for urine Cd) were used for the validation experiment. Using CRM, SRM, and Bio-Rad, we conducted repeated analyses on recovery, relative standard deviation, and linearity three times to obtain results within the confidence level [1,15,21,22].
Statistical Analysis
The statistical analysis was performed using R version 2.15.2. The concentrations of heavy metals in food were presented as a median value and a mean value. If the samples were under the LOD level, we applied the LOD
We used the geometric mean (GM) value for the human biomonitoring (HBM) results. For the results under the LOD value, we applied the LOD
Results
Concentration in Food Chains
Pb, Cd, and Hg concentrations in food were determined in 4410 food samples (18 food groups). The detection rate was 76.6% for Pb, 87.4% for Cd, and 78.0% for Hg. Among the 18 food groups, Pb was highly concentrated in seaweed, shellfish and crustaceans, mollusks, fish, and sugar and sugar products (median value: 94.2, 91.4, 62.4, 8.13, and 4.61 μg/kg, respectively). Cd was highly concentrated in seaweed, shellfish and crustaceans, mollusks, nuts and seeds, and flavorings (median value: 594, 186, 155, 15.7, and 6.23 μg/kg, respectively). Hg was highly concentrated in fish, mollusks, shellfish and crustaceans, nuts and seeds, and sugar and sugar products (median value: 46.4, 23.5, 15.7, 4.86, and 2.11 μg/kg, respectively) (Table 4). The herbal medicine analysis was conducted on 92-93 samples (92 samples for Hg). The detection rate was 79.6% for Pb, 12.9% for Cd, and 37.0% for Hg. The functional food analysis was conducted in 873-888 samples (873 samples for Hg). The detection rate was 62.6% for Pb, 40.4% for Cd, and 32.6% for Hg. The median value of heavy metals in herbal medicine was 19.8 μg/kg for Pb, 1.26 μg/kg for Cd, and 3.57 μg/kg for Hg. The median value of heavy metals in functional food was 14.0 μg/kg for Pb, 1.26 μg/kg for Cd, and 3.57 μg/kg for Hg.

The concentrations of Pb, Cd, and Hg in the food groups with high level, functional food, and herbal medicines in this study
Dietary Exposure Level
The intake rate of herbal medicines and functional foods in the general population was 23.1 and 35.2%, respectively (intake during the previous year for more than two weeks). The dietary exposure to Pb level was 0.14 μg/kg bw/d, the dietary exposure to Cd level was 0.18 μg/kg bw/d, and the dietary exposure to Hg level was 0.07 μg/kg bw/d (Table 5).
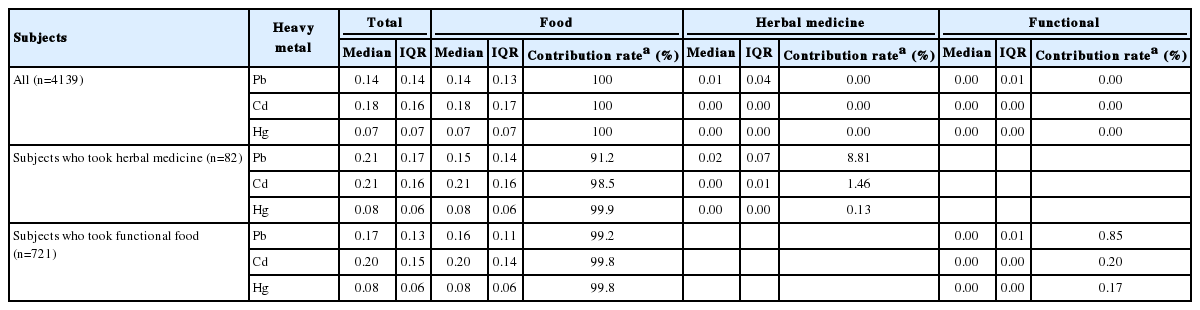
The dietary exposure to heavy metal level and contribution rates of food, herbal medicine, and functional food in this study
For the contribution rate in dietary exposure route of all the subjects, food was the main exposure route for Pb, Cd, and Hg (100%). For the subjects who took herbal medicines (n=82), the contribution rates of herbal medicines were 8.81% for Pb, 1.46% for Cd, and 0.13% for Hg. For the subjects who took functional foods (n=721), the contribution rates of functional foods were 0.85% for Pb, 0.20% for Cd, and 0.17% for Hg (Table 5).
Internal Exposure Level
The subjects who had a blood Pb level of less than 5 μg/dL (CDC, reference value for those 1 to 5 years of age) accounted for 99.0% (n=4414) of all subjects. Only one subject was found with a blood Pb level of more than 10 μg/dL (CDC, permission criterion for adults) (Table 6). Subjects who had a blood Cd level of less than 0.3 μg/L (German Federal Environmental Agency reference value for non-smoking children) were 24.5% (n=1125) of all subjects. Subjects who had a blood Cd level of more than 1 μg/L (German Federal Environmental Agency reference value for non-smoking adults) were 34.6% (n= 1587) of all subjects. The subjects who had a blood Hg level of less than 5 μg/L (HBM I value for children and adults) accounted for 81.0% (n=3698) of all subjects. The subjects who had a blood Hg level of more than 15 μg/L (HBM II value for children and adults) accounted for 1.20% (n= 55) of all subjects.

The evaluation biomonitoring results of this study according to the reference value
Discussion
The aim of this survey was to evaluate the status of exposure to hazardous substances through food, herbal medicine, and functional food under a real-life pattern. This was the first nationwide survey of integrated dietary exposure to hazardous substances. This survey conducted a food analysis, integrated dietary exposure assessment, and analyses on the internal exposure levels of the same subjects in one track (Figure 2).
Survey framework. This survey analyzed integrated dietary exposure assessments to hazardous substances through food, herbal medicine, and functional food under a real-life pattern. This survey conducted a food analysis, integrated dietary exposure assessment, and analyses on the internal exposure levels of the same subjects in one track.
Compared with the European Union (EU) on the concentration of hazardous substances in the food chain, we observed some differences. The EU food groups with a high concentration of Pb (median value) were fish and seafood (0.00 to 40.0 μg/kg), coffee, tea, and cocoa (1.30 to 39.0 μg/kg), sugar and sugar products (0.00 to 37.0 μg/kg), and cereals and cereal products (0.00 to 26.7 μg/kg) [6]. In this survey (median value), fish (8.13 μg/kg), shellfish and crustaceans (136.4 μg/kg), and mollusks (62.4 μg/kg) were the food groups with a high level of Pb. The Pb level in beverages in this survey was 11.0 μg/kg, and beverages included in the survey were fruit juice, carbonated fruit juice, carbonated drinks, sports drinks, and coffee. The Pb level in coffee in this survey was 2.10 μg/kg, which was less than the level found in the coffee in the EU (0.00 to 20.0 μg/kg). The Pb levels in sugar and sugar products and cereals in this survey (4.61 and 4.74 μg/kg, respectively) were relatively lower than those of the EU.
The dietary Pb exposure level of adults in this survey was 0.13 μg/kg bw/d (mean value), which was less than the dietary exposure level of adults in the EU (mean value, 0.36-1.24 μg/kg bw/d) [6].
The blood Pb level in this survey was 2.22 μg/dL (GM value, adults), the blood Pb level of the KNEHS survey in 2008 was 1.91 μg/dL (GM value, adults) [13], and the KNHANES survey Pb level in 2005 was 2.61 μg/dL (GM value, adults) [11]. Blood Pb level is associated with food, water, air, soil, and dust [6]. After Korea banned the use of leaded gasoline in 1993, the blood Pb level decreased [11]. The blood Pb level of the German Environmental Survey (GerES) in 1998 was 3.16 μg/dL (GM value, 18 to 69 years of age) [26,27]. The blood Pb level of the National Health and Nutrition Examination Survey (NHANES) in 2007 to 2008 was 1.38 μg/dL (GM value, 20 years and older) [27], compared with NHANES, where the Korean blood Pb level was still more than 50%.
In the EU, the food groups with high levels of Cd (median value) were coffee, tea, and cocoa (21.0 μg/kg), cereal and cereal products (16.0 μg/kg), and fish and seafood (13.0 μg/kg) [7,29]. In this survey (median value), fish (5.35 μg/kg), shellfish and crustaceans (186.0 μg/kg), mollusks (155.0 μg/kg), and cereal (11.6 μg/kg) were food groups with high Cd levels. The Cd level in rice in this survey was 15.4 μg/kg, which was less than the Cd level in rice in the EU (20.0 μg/kg). The Cd level in wheat grains and flour in the EU was 26.0 μg/kg [29].
The dietary Cd exposure level of adults in this survey was 0.17 μg/kg bw/d (mean value), which was less than the dietary Cd exposure level of adults in the EU (mean value, 0.17-0.36 μg/kg bw/d) [7,30].
In this survey, the food groups with a high contribution rate (mean value) of Cd were grain and grain-based products (40.4±15.8%), vegetables and vegetable products (16.5±9.2%), and fish and shellfish (17.9±21.7%). In the EU, the contribution rate (mean value) was high in grain and grain-based products (21 to 35.5%), starchy roots and tubers (5.54 to 30.5%), meat and edible offal (5.51 to 24.5%), vegetables and vegetable products (4.6 to 25.9%), and fish and other seafood (1.20 to 31.2%) [7]. The contribution rate of exposure to Cd was 4.4 to 5.0% in starchy roots and tubers, and 0.1 to 0.4% in meat, which was lower than in the EU.
The blood Cd level (GM value) of adults in this survey was 1.06 μg/L, and the blood Cd level of non-smoking adults was 1.04 μg/L. The blood Cd level of the KNHANES study in 2005 was 1.53 μg/L (GM value, adults) [11]. The blood Cd level of the GerES study in 1998 was 0.43 μg/L (GM value, 18-69 years) [27]. The blood Cd level of the NHANES study in 2007–2008 was 0.38 μg/L (GM value, 20 years and older) [28]. The Korean blood Cd level was higher than the GerES and NHANES studies.
The internal Cd level is associated with age, smoking, and dietary exposure. Dietary exposure to Cd was 90% among non-smokers [7,31,32]. Comparing the dietary exposure to Cd with the internal Cd level, the blood Cd level of this survey was two times higher than in the EU, while the dietary exposure to Cd level was 30% lower than in the EU. The discrepancies in the dietary exposure levels and blood Cd levels can be attributed to various factors. First of all, a gap exists in the level of exposure attributable to dietary pattern, as the contribution rate of starchy roots and tubers and meat, for which the dietary Cd exposure level was high in the EU, was relatively low in this study. Also, the EU dietary Cd exposure level was based on a calculation of dietary exposure level with 13929 participants and based on 178541 data samples on Cd in food, relying on a much larger data base than this survey. However, the dietary exposure and blood concentration were measured at the same time in this survey, while in the EU the dietary level and biomonitoring data were measured in 1997 to 2009 and 1998, respectively, and the Cd exposure level in food was based on the data collected from 2003 to 2007 in Europe.
In the EU, the food groups with high levels of Hg (median value) were fish and seafood (43.0 μg/kg), composite food (6.60 μg/kg), products for special nutritional use (2.90 μg/kg), herbs, and spices and condiments (2.00 μg/kg) [8]. In this survey (median value), fish (46.4 μg/kg), shellfish and crustaceans (15.7 μg/kg), and mollusks (23.5 μg/kg) were the food groups with high levels of Hg. However, the functional food (3.57 μg/kg) and flavoring (1.12 μg/kg) of this survey had lower concentration levels. The highest concentration food in composite food category (convenience food) of the EU was fish and seafood based meals (23.0 μg/kg).
The dietary Hg exposure level of adults in this survey was 0.07 μg/kg bw/d (mean value), while the dietary Hg exposure level of adults in the EU was 0.02 to 0.05 μg/kg bw/d (mean value) [8].
In this survey, the food groups with a high contribution rate of Hg (mean value) were fish and shellfish (37.4±27.1%), grain and grain-based products (24.4±13.9%), and vegetables and vegetable products (10.7±7.40%), while in the EU the contribution rate of Hg (mean value) was high in fish and other seafood (3.70 to 53.0%), non-alcoholic beverages (1.60 to 43.0%), and composite food (0.00 to 40.0%).
The contribution rate of grain and grain-based products (6.90 to 17.0%) on Hg in the EU was lower than in this survey, while the contribution rate of vegetables and vegetable products (1.30 to 26.0%) on Hg was higher than in this survey.
The blood Hg level in this survey was 3.90 μg/L (GM value, adults), the blood Hg level in the KNEHS survey in 2008 was 3.23 μg/L (GM value, adults) [13], and the blood Hg level in the KNHANES in 2005 was 4.15 μg/L (GM value, adults) [11]. The blood Hg level of the GerES in 1998 in subjects aged 18 to 69 years was 0.61 μg/L (GM value) [27]. The blood Hg level of the NHANES in 2007 to 2008 in subjects 20 years and older was 0.94 μg/L (GM value) [29]. The Korean blood Hg level was higher than that of the subjects of the GerES and NHANES studies.
The blood Hg level and dietary exposure level of Hg were both higher than those in the EU. The Hg level in food was high in fish and the contribution rate of dietary exposure to Hg in this survey was higher than in the EU, indicating that the blood Hg level is relatively high in Koreans since they frequently consume food of high Hg concentration [33,34].
In this survey, limitations lie in the fact that it is a cross-sectional study and that it was conducted in the format of a market-based survey instead of collecting food directly from the survey participants. Also, the food survey was limited to highly and frequently consumed food. The two-time 24-hour discontinuous recall survey is not sufficient to reflect general dietary intake patterns to the full.
In summary, this paper introduced the survey design and presented partial results of the dietary exposure status and internal exposure levels of Pb, Cd, and Hg. The food groups of seaweed, shellfish and crustaceans, mollusks, and fish had a high exposure concentration of heavy metals. In the general population, food was the main exposure route for Pb, Cd, and Hg. Further study is needed to define the correlation between dietary exposure and internal exposure level.
Acknowledgements
We thank all of the participating survey subjects and participating researchers. We particularly thank Su-Jeong Kim, Hyun-Suk Hong, Yoon-Hee Kim, Young-Eun Lee, Seong Ok Kwon, Hyou Mi Park, Ji Yeon Lee, Dong Heon Kim, Sun Hee Choi, Snag Yong Eum, Yu Mi Kim, Yong Yun Yun, Ji Won Won, Dong Heon Lee, Woo Suk Kim, Ju Yi Seo, Hyon Mi Cheon, Bo Won Seo, and Yin Tae Kim for their efforts in the field survey, management, and the analysis.
This research was supported by the Korea Food & Drug Administration in 2015 (14162MFDS655).
Notes
The authors have no conflicts of interest with material presented in this paper.