Priority survey between indicators and analytic hierarchy process analysis for green chemistry technology assessment
Article information
Abstract
Objectives
This study presents the indicators and proxy variables for the quantitative assessment of green chemistry technologies and evaluates the relative importance of each assessment element by consulting experts from the fields of ecology, chemistry, safety, and public health.
Methods
The results collected were subjected to an analytic hierarchy process to obtain the weights of the indicators and the proxy variables.
Results
These weights may prove useful in avoiding having to resort to qualitative means in absence of weights between indicators when integrating the results of quantitative assessment by indicator.
Conclusions
This study points to the limitations of current quantitative assessment techniques for green chemistry technologies and seeks to present the future direction for quantitative assessment of green chemistry technologies.
Introduction
There is widespread interest in synergistic relationship between ecological conservation and economic development for the achievement of sustainable development. In the chemical industry, this trend led to the concept of green chemistry.
Green chemistry encompasses technologies for designing chemical products or processes minimizing the use and generation of hazardous or contaminating substances. It contributes to creating a sustainable society at molecular level, based on the possibility of controlling chemical processes to meet environmental and economic goals simultaneously, and represents the design concept that embraces the human will to seek sustainable development [1].
Dr. P. T. Anastas, the father of green chemistry, specified 12 principles of green chemistry as guidelines for ecofriendly synthesis of new chemical compounds and recommended their application in terms of conversion efficiency, safety, toxicity, and biodegrade ability. The 12 principles of green chemistry [2] are outlined below.
Twelve Principles of Green Chemistry
Principle 1. Prevent waste: generation of waste should be prevented at source rather than end-of-pipe waste treatment or disposal.
Principle 2. Atom economy: material syntheses should be designed so that the final product contains the maximum proportion of the starting materials.
Principle 3. Low-hazard chemical syntheses: materials should be synthesized using materials with little or no hazard to humans or environment.
Principle 4. Safer chemicals design: chemical products should be designed tohave little or no toxicity while maintaining the intended function.
Principle 5. Safer solvents and auxiliaries: use of solvents and chemicals other than starting materials should be minimized, and they should be innocuous if used.
Principle 6. Energy-efficient design: chemical processes should be energy-efficient and conducted at ambient temperature and pressure.
Principle 7. Renewable feedstock: a raw material or feedstock should be renewable rather than depleting.
Principle 8. Minimization of chemical derivatives: unnecessary use of blocking groups or protection/deprotection should be avoided.
Principle 9. Use of selective catalysts: highly selective catalysts are preferable to stoichiometric reagents.
Principle 10. Design of degradable chemical products: chemical products should be designed to break down into innocuous substances at the end of their function and not persist in the environment.
Principle 11. Preventive real-time analysis: syntheses should be monitored and controlled real-time to prevent formation of hazardous substances.
Principle 12. Inherently safer chemistry for accident prevention: substances used in a chemical process should minimize the potential for accidents such as leakages, explosions, and fires.
Green Chemistry Technology Assessment Tools
Since the introduction of green chemistry, leading countries in the chemical industry, such as the US, Japan, and Germany, have developed various green chemistry technologies and have been putting every effort to establish the these technologies.
The Lowell Center for sustainable production has presented the key elements [3] to evaluate the safety of potential alternatives in three steps:
1) Alternatives assessment foundation: articulating the basic goals, principles, and decision-making rules.
2) Alternatives assessment process: this module is divided into comparative and design assessments. The comparative assessment evaluates the alternatives to the existing chemicals or products through the selection of alternatives, confirmation of final applications, and identification and comparison of concrete alternatives. The design assessment is performed for products under development by specifying the features of new materials and by assessing corresponding alternatives that are safer and socially preferable.
3) Alternatives assessment evaluation: concrete comparative or design assessment items are evaluated in terms of human health and environmental impacts, social contribution, economic feasibility, and technical performance.
Emission factor rating, which estimates the amount of waste generated when manufacturing 1 kg of a product, is a green chemistry assessment tool developed in the US. It is the fastest and simplest method for evaluating the level of compliance with the principles of green chemistry (hereafter greenness).
These assessments can be used by experts designing new chemical processes or products via Synthetic Methodology Assessment for Reduction Technique modules of the Green Chemistry Expert System (GCES) distributed free of charge.
Japan Chemical Innovation and Inspection Institute (JCII) has promoted Green and Sustainable Chemistry (GSC) to empower the national chemical industry to attain international leadership through integrated collaboration of industry, academia, and public authorities towards sustainable development favorable for humans and ecosystems. GSC refers to technologies for improving important chemical processes and products to conserve resource and energy and to avoid the use of hazardous substances. JCII have been developing green chemistry assessment techniques to demonstrate the aspects and degrees of improvement achieved by green technologies compared with conventional ones.
The Committee of the GSC Network Japan proposed the evaluation method impact metrics for environmental, safety, and socioeconomic (i-Messe) [4], in order to enable the comparative evaluation of new chemical processes or products against the conventional ones. It uses simplified life cycle assessment to quantify the environmental impact and safety level and balance the interests of various stakeholders from the viewpoint of environmental compatibility, safety, and socioeconomic impact. The evaluation of these aspects is done by quantitative and quantitative assessments of the four items associated with them, reflecting in the comprehensive rating of a new chemical process or product. Table S1 presents the items used for assessing these three aspects by comparing the life cycle from raw material preparation, use, transport, storage, and disposal/recycling of the chemical process or product before and after the improvement achieved by the application of the green chemistry technology concerned. The evaluation results are schematically presented in Table S1. The i-Messe was developed to establish the criteria for rating the technologies submitted for green chemistry award and to standardize the assessment techniques. Set up a complete assessment system is planned by the end of 2015.
Toxic potential indicator (TPI) developed by the Fraunhofer Institute for Reliability and Micro-integration, Germany, indicates potential toxicity of a material as a relative numerical score scaled between 0 (substance with no known hazard) and 100 (extremely hazardous substance) [5]. Even though TPI does not directly assess green chemistry technologies, it can be an evaluation tool as it quantifies the potential toxicity of the chemical composition of a product. TPI is used as a major indicator when evaluating disaster safety and health safety in i- Messe.
TPI derives the toxic effects of a material on three domains (health, environment, and safety) from three input parameters. TPI values of individual substances, which quantify the potential impacts associated with environmental, health, and safety factors, is calculated as follows [6]:
Where N denotes the standard numerical scale of the potential environmental impact pertaining to each input parameter I (scale of Ni: 0 to7), n is the number of Ni, and Nsubstance is the numerical scale of the material after the aggregation of input parameters.
Safety impact: R-phrases are used for quantifying the degree of hazard or safety by substance in TPI. They encompass potentials for ignition, health risk, and ecological threat; specifically, impacts on non-carcinogenic endpoints such as reproductive, developmental, or fertility factors, are taken into account. Plural R-phrases are used to quantify multiple risks of a substance.
Health impact: effects of a material on human health are quantified using maximum workplace concentration Maximale Arbeitsplatz Kozentration (MAK), European Union (EU) carcinogen classification, and R-phrase.
MAK was proposed by the German Research Foundation (Deutsche Forschungsgemeinschaft) as a standard measure for occupational exposure limit of airborne hazardous substances. MAK list differentiates between EU carcinogenic category 1, 2, and 3 [7].
EU carcinogen classification comprises three categories: categories 1 and 2 for substances known to be or presumed carcinogenic to humans, respectively, and category 3 for substances with yet-to-be-confirmed carcinogenic potential for humans. Categories 1 and 2 correspond to Nhealth impact 7 (maximum impact) and category 3 to 6.
Environmental impact: in TPI, ecological effects of a material are quantified using water hazard classes (Wassergefahrenklasse ; WGK) in addition to R-phrase. WGK classifies the toxicities of materials in increasing order as WGK1, WGK2, and WGK3, converted into an internal scale NWGK 0, 3, 5, and 7. WGK is defined as per German regulations, taking into account environmental toxicity data such as acute toxicity on mammals and aquatic animals, using information including lethal dose for 50 percent kill or lethal concentration 50 data.
Rationale of This Study
Businesses also promote green chemistry technologies, not only for economic benefits, but also for environmental improvement. In the US, presidential awards are granted to excellent green chemistry technologies. Japan grants annual awards by rating GSC technologies with a quantitative assessment system developed by the JCII. In Korea, the Green Chemistry Center in the Korea Environment Corporation was inaugurated in 2013.
Along with the worldwide advances in green chemistry technologies, there is an increasing demand for objective assessment of their performances. This study proposes items (performance indicators) for quantifying the greenness of chemical processes or technologies already developed or under development, i.e., their contribution to reducing risks to health and environment. To enable an integrated evaluation of all contribution factors, weights between the indicators are also established via analytic hierarchy process (AHP).
Materials and Methods
Selection of Indicators
Indicators should be matched with the respective quantifiable proxy variables pertinent to the objectives of green chemistry. Currently available assessment methods developed in other countries evaluate the greenness of green chemistry technologies based on three aspects: direct impact on humans (health impact), their living environments (environmental impact), and social and economic conditions of everyday life (socioeconomic impact).
In the aforementioned assessment techniques, these are assessed independently and the impacts induced through their interactions, e.g., environmental impact on humans, remain unclear. Therefore, to display the ultimate effects of safety and environmental factors on human health more accurately, we selected environmental and safety factors as indicators for their direct impacts on humans at the national level, and the reduction of greenhouse gases (GHGs) as an indicator at the global level. Lastly, socioeconomic impact associated with daily living was selected as the fourth indicator, and its comparative analysis was performed by quantifying the values determined by market economy, e.g., the added value of resources and the cost of waste treatment.
Considering the above-mentioned factors, the indicators finally selected are: 1) “environment,” indicating the emissions of the substances generated during chemical processes, thereby subdividing them into GHGs (global dimension) and those hazardous to humans ecosystems (local dimension); 2) “safety,” indicating the potential for industrial chemical accidents such as explosions and fires; 3) “resource,” indicating resource consumption from a social viewpoint; and 4) “economy,” indicating the economic feasibility of green chemistry technologies.
The greenness of green chemistry technologies can be quantified by the following aggregation equation (1).
Analytic Hierarchy Process
The foreign assessment techniques, in which various proxy variables are quantified using separate methods, show limitations in discerning the inter-indicator relationships and their relative contributions to overall improvement.
To address this problem, we performed expert survey-based AHP analysis and determined the weights between the indicators for quantitative assessment of the greenness of green chemistry technologies.
AHP is a decision-making process employed in situations requiring multi-criteria assessment [8]. It was designed to answer the question “which one is more important among the multiple issues investigated?” As such, it is a solution-oriented decision-making paradigm, which harmonizes subjective judgment and a systematic approach. AHP regards the elements of a problem as hierarchical relationships between final goal, alternatives to reach the goal, and criteria for evaluating decision options. The importance of alternatives relative to the final goal is determined through pairwise comparison between the alternatives relative to each assessment criterion. Finally, the total assessment value of each alternative is calculated.
This process is analogous to complex problem solving processes, in which the elements of a complex problem is arranged in a hierarchy and tackled systematically. The main thread that runs through the AHP system, ensuring its consistent rationality is the pairwise comparison of all possible combinations of all elements constituting the judgment process for the decisionmaking scope of the problem.
In AHP, the priority order for the problem is set according to the three principles: stratification, pairwise comparison, and priority calculation, as described below [8].
Stratification of the problem: the problem is broken down into a hierarchical structure of goal, assessment criteria, and decision alternatives consisting of their respective decision elements. The assessment criteria level is stratified by the decision-maker. Multiple items associated with each assessment item are then arranged below the decision alternatives level, thus completing the hierarchical structure.
Pairwise comparison and importance evaluation: relative importance of all decision elements is determined through pairwise comparison with the associated element in the higher level. The consistency of pairwise comparison is given by the consistency index (CI). Saaty [8] proposed that CI up to 0.1 is adequate and pairwise comparison with a CI above 0.1 should be rechecked.
Priority calculation: the priority of each alternative is calculated by aggregating the relative importance assessed at each level and calculating the relative importance of the whole level.
Surveys designed for AHP should be constituted with regular interval rules enabling quantitative comparison of levels. This endows meanings to the deviations at each level as average values. For example, if scores are retrieved on a scale of “very important” (3 points), “important” (2 points), “average” (1 point), “not important” (1/2 points), “not important at all” (1/3 points), a score of 2.4 points should be constant. In other words, each pairwise comparison value is simplified by calculating the average of the results of various surveys, and the calculated values are used in AHP [8].
In this study, AHP was performed to obtain the weights between indicators as relative importance, representing proxy variables as the configuration basis for a quantitative assessment of greenness using equation (2).
where α, β, γ, and δ denote weights between indicators.
Analytic Hierarchy Process-based Establishment of Weights for Proxy Variables of Greenness Indicators
Pairwise comparison of indicators (environment, safety, resource, and economy) was performed to establish the weights for assessment criteria. For this purpose, experts were selected from academia (106 chemistry and ecology professors from domestic universities), research institutes (108 researchers in national chemistry, environment, and health-related institutes), and industry (131 experts in charge of chemistry and environment divisions of domestic companies) and were provided with the following explanations.
Environment: the degree of contribution to reducing the impact of the substances generated during chemical processes on humans and ecosystems. It is divided into global impact (GHGs) and local impact (hazardous substances with potential risks for humans and ecosystems including chemicals used for or generated from chemical processes and emissions to the ecosystems).
Safety: the degree of absence of chemical or physical properties of the substances used in chemical processes that are likely to incur explosions or fires.
Resource: includes all feedstocks used as input for chemical processes. In terms of resource, green chemistry technologies are those consuming less depleting feedstocks and having high recycling rates.
Economy: this denotes the economic benefits achieved by green chemistry technologies. For example, high market-share of a developed green chemistry technology for a production method or product indicates better economy of that technology.
Pairwise comparison between indicators was scored on a 5-point scale (very important, 5; somewhat important, 3; similarly important, 1), as reflected by general weights and AHP weights presented below. For actual evaluation, the results of internet-based evaluations were extracted (Table S2).
Figure 1 shows a schematic of the indicators and their subordinate-level proxy variables (alternatives) structure for greenness analysis.
Schematic of analysis levels of analytic hierarchy process for greenness analysis.
Results
Table 1 outlines the results of pairwise comparisons between the four indicators (environment, safety, resource, and economy), conducted in order to estimate their weights.
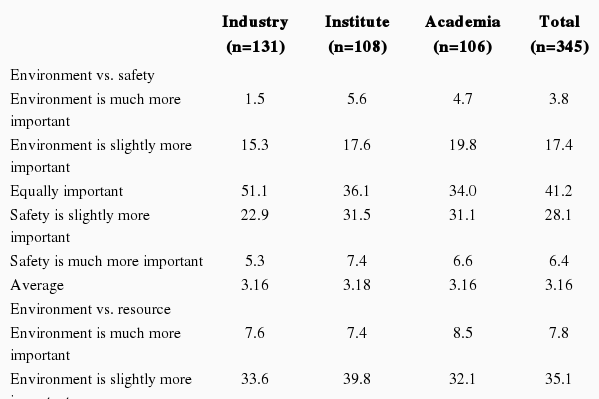
Results of pairwise comparisons between environment, safety, resource, and economy
From the pairwise comparisons, the following conclusions were drawn.
The comparison between environment and safety showed that safety is evaluated as being slightly more important in general, with the institutes giving more importance to safety and the industry to environment.
Between environment and resource, more importance was given to environment.
Environment was evaluated to be more important than economy.
In the comparison between technologies enhancing safety and those reducing resource consumption, safety received a much higher rating (66%).
Safety was considered a lot more important (≥70%) than economy.
Resource and economy were similarly rated in general.
Table 2 outlines the results of AHP performed item-by-item, based on the results from pairwise comparisons. The weights for the assessment criteria have been arranged in the following order by the entire expert group: safety (0.393) >environment (0.286)>resource (0.172)>economy (0.148). This result asserts that the higher the degree of improving safety, the higher the greenness of the applied technology as per equation (2).

Indicator’s weights by indicator and evaluating group
No significant inter-evaluator differences were observed among the experts from academia and institutes. While they evaluated resource to be more important than economy, experts from the industry rated economy higher. CI values were all below 0.01, thus demonstrating that the results are highly consistent.
GHGs were chosen as proxy variable for environment in response to the increasing social demand for ecological efforts to combat GHGs. In addition to the impact on global warming, GHGs exert different influences on local environments (hazardous to humans and ecosystems), and should be regarded as a variable for environment as hazardous substances. The indicator “safety” is by nature of local scope and should thus be evaluated without distinction between GHGs and hazardous substances.
The evaluation results of environment, depending on the scope of influence, revealed that the weight for technologies reducing hazardous substances was considered about 2.6-fold more important than the weight for technologies reducing GHGs (0.726 vs. 0.274). The evaluation of technologies reducing hazardous substances, thereby making a distinction between humans and ecosystems, revealed that human-health-related technologies were about 2-fold more important than the ecology- related technologies (0.684 vs. 0.316) (Table 3). Only negligible differences were observed between expert groups.
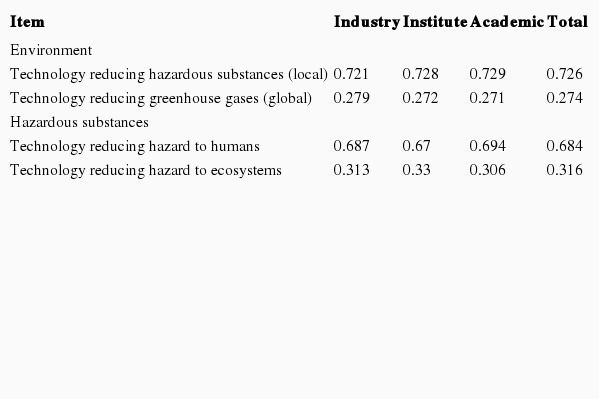
Results of analyzing weights for the local/global distinction of the indicator “environment” and the for the humans/ecosystems distinction of the proxy variable “hazardous substances”
Environment-related and safety-related regulations applied to chemical processes are the minimum requirements to protect humans and ecosystems from their adverse effects. To improve the environmental environment and safety of such materials, it is essential to reduce their potential risks. Given that potential risks involving the same substance may vary according to their production processes, we divided the hazardous substances into feedstock, product, and emission, according to their processing stages in order to evaluate the importance of the technologies reducing their hazardous effects and enhancing their safeties. Despite slight differences among expert groups regarding the hazardous effects on humans and ecosystems, all of them attached the highest importance to the high exposure risks posed by emissions and the lowest importance to those posed by feedstocks. As regards safety, while the experts from institutes and academia regarded the technologies enhancing the safety of emissions as most important and those for feedstocks less important, the experts from the industry attached give similar weights to emission, product, and feedstock in decreasing order of importance (Table 4).

Results of weight analysis for hazard and safety at each process level
As described above, the indicator “safety” (0.393) was rated the most important indicator. Of its proxy variables, “emission,” i.e., technologies improving the safety of the substances released to the environment, was rated the most important (0.398). This is assumed to reflect the relative values influenced by temporal and social circumstances. For example, in addition to the properties likely to induce explosions or fires, the increased public attention to emissions immediately after large-scale chemical accidents, e.g., the hydrofluoric acid spill in Gumi in Korea (2012) and Fukushima Daiichi nuclear disaster in Japan (2011), is assumed to have been reflected in the weights for emission, given that the survey was conducted not long after these accidents.
The level weight obtained by multiplying the partial weight for the technologies enhancing emission safety by the weight of the indicator “safety” was 0.156, which demonstrates the importance placed on “reserve” and “economy” among the four indicators.
The level weights for the hazards to humans and ecosystems, which are proxy variables of the indicator “environment,” were 0.142 and 0.066, respectively. When compared to the importance of GHGs, GHGs are more important than the hazard to ecosystems and less important than the hazard to humans (Table 5).
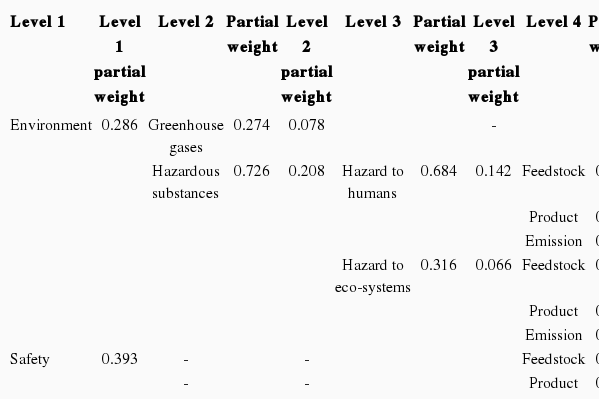
Results of systematic analysis of weight values by level and item
Discussion
This study presented indicators and proxy variables for quantitative assessment of green chemistry technologies and evaluated their relative importance (weights) by conducting a survey with experts from the fields of environment, chemistry, safety, and public health. The results collected were subjected to AHP analysis that presented the weights of all indicators and proxy variables.
A limitation of this study may be that the survey was conducted amidst elevated interest in chemical safety across the world due to large-scale chemical accidents and consequently, the relative importance for safety was favored over other elements. In order to adjust such biased weights, it is necessary to repeat the evaluation after a certain lapse of time. Another limitation is that the improvement in greenness was not verified by comparing the green chemistry technologies already developed or under development with relevant conventional technologies. While this may overcome the difficulties of comparing among green chemistry technologies, given their wide scope, it is not suitable for establishing priorities for the commercialization of the new technologies. For example, a technology with relatively small degree of improvement can have high priority if it has a broad application scope and a large market share. Therefore, designing an assessment technique that can reflect both the degree of improvement in greenness and the involved market share is necessary.
For refining the assessment technique by indicator, quantitative standards will have to be established for the indicator “resource.” Simply converting the achieved reduction in resource consumption into currency would lack reliability due to the discrepancy between purchaser and manufacturer estimates. Conversion into primary materials (e.g., crude oil) may be a more reliable method, but the relative importance of each primary material should be established first. The indicator “economy” will have to reflect both economic benefits and market share.
Acknowledgements
This study was supported by the Korea Ministry of Environment (MOE) as “MOE’s R&D Program on environmental technology development” (no. 412-111-007), and by Korea Environment Institute (KEI, 2014-025).
Notes
The authors have no conflicts of interest with material presented in this paper.
Supplementary Material
i-Messe assessment items
Scale 5-point for pairwise comparison between indicators