Maintaining the Constant Exposure Condition for an Acute Caenorhabditis elegans Mortality Test Using Passive Dosing
Article information
Abstract
Objectives
Maintaining the constant exposure to hydrophobic organic compouds in acute toxicity tests is one of the most difficult issues in the evaluation of their toxicity and corresponding risks. Passive dosing is an emerging tool to keep constant aqueous concentration because of the overwhelming mass loaded in the dosing phase. The primary objectives of this study were to develop the constant exposure condition for an acute mortality test and to compare the performance of the passive dosing method with the conventional spiking with co-solvent.
Methods
A custom cut polydimethylsiloxane (PDMS) tubing loaded with benzyl butyl phthalate (BBP) was placed in each well of a 24-well plate containing assay medium. The rate of the release of BBP from PDMS was evaluated by measuring the change in the concentration of BBP in the assay medium. The efficiency of maintaining constant exposure condition was also evaluated using a simple two-compartment mass transport model employing a film-diffusion theory. An acute mortality test using 10 C. elegans in each well was conducted for the evaluation of the validity of passive dosing and the comparative evaluation of the passive dosing method and the conventional spiking method.
Results
Free concentration in the assay medium reached 95% steady state value within 2.2 hours without test organisms, indicating that this passive dosing method is useful for an acute toxicity test in 24 hours. The measured concentration after the mortality test agreed well with the estimated values from partitioning between PDMS and the assay medium. However, the difference between the nominal and the free concentration became larger as the spiked concentration approached water solubility, indicating the instability of the conventional spiking with a co-solvent.
Conclusions
The results in this study support that passive dosing provides a stable exposure condition for an acute toxicity test. Thus, it is likely that more reliable toxicity assessment can be made for hydrophobic chemicals using passive dosing.
INTRODUCTION
Acute toxicity of hydrophobic chemicals to aquatic organisms is evaluated in the initial screening stage of their hazards and the subsequent evaluation of environmental risks. Because many hydrophobic organic chemicals do not readily dissolve in water, they are introduced into water via co-solvent for the evaluation of toxicity. Although the amount of a chemical introduced in the assay medium is known, it is difficult to know the free concentration which is thought to be responsible for toxicity on organisms. Hydrophobic chemicals may (ad)sorb to wall surfaces or other sorbing phases in water such as dissolved and particulate organic matter, volatilize from the medium, or undergo transformation during the test [1-3]. Thus, maintaining constant exposure condition is one of the critical issues when bioassays are used for the evaluation of toxicity of hydrophobic chemicals.
Recent development of passive sampling/dosing techniques proposed a new way to assess the exposure and toxicity by controlling free concentration in the test medium. Chemicals are released via passive diffusion from the dosing phase (usually polymers) in which vast amount of chemical is loaded [4-9]. This makes it possible to overcome problems associated with sorption and other losses leading to poorly defined exposure via the continuous partitioning of hydrophobic organic chemicals from a polymer such as silicone. Because the overall mass in a test system remains mostly in the dosing phase, it is easy to provide defined and constant freely dissolved concentrations and to eliminate any disturbance caused by the addition of co-solvents.
In this study, a passive dosing method was developed and applied for an acute toxicity of benzyl butyl phthalate (BBP) to C. elegans in a 24-well plate. Custom-cut polydimethylsiloxane (PDMS) tubing was loaded with BBP to desired concentration and used as a dosing phase. Release kinetics of BBP was monitored and kinetic parameters were obtained to evaluate the ability of the method to maintain constant exposure condition. The performance of the passive dosing method was also compared with that of active spiking using dimethylsulfoxide as a co-solvent.
MATERIALS AND METHODS
I. Chemicals and Materials
BBP was purchased from Sigma-Aldrich (>98%, St. Louis, MO, USA). Methanol and dimethylsulfoxide (DMSO) were also purchased from Sigma-Aldrich (>98%). PDMS tubing (outer diameter 16.5 mm, inner diameter 12 mm, density 1.18 g/mL) was purchased from a local provider (Dongbang Silicone, Kimpo, Korea). The PDMS tubing was cut into a size fit in a well of a 24-well plate. The height was 14.6 mm and the mass of each PDMS was measured 1.726 g (n=20, standard deviation [SD]=0.0084 g). They were cleaned with n-hexane and methanol for 1.5 hours each in a Soxhlet extractor. Cleaned PDMS tubings were stored in methanol until use.
II. Loading BBP into PDMS
In order to load PDMS with desired concentration of BBP, partition coefficient of BBP between PDMS and the loading solution (methanol: deionized water = 6:4) was determined. It was found out that incubating for 48 hours in a shaking incubator (150 rpm) was sufficient for attaining equilibrium between PDMS and the loading solution. The partition coefficient between PDMS and the loading solution (KPDMS/loading solution) was determined by measuring the concentration in PDMS (CPDMS,0, mol/L) and the loading solution (Cloading solution, mol/L) independently.

The loading solution equilibrated was directly subjected to high-performance liquid chromatography (HPLC) analysis and the concentration in PDMS was quantified after extracting with 30 mL methanol. The concentration of BBP loaded into PDMS was then calculated from the concentration of BBP in the loading solution. After the loading, PDMS tubings were dried at room temperature for 1.5 hours to remove residual methanol swallowed by PDMS and placed into a well of a 24 well-plate for the determination of desorption kinetic parameters or acute toxicity tests.
III. Determination of Kinetics Parameters for Desorption from PDMS
The change in the concentration of BBP in the assay medium (0.032 M KCl and 0.051 M NaCl) [10] was monitored to evaluate the performance of the passive dosing technique. Each well is filled with 1.5 mL of the assay medium and BBP was delivered from the PDMS tubing (Figure 1). Applying a two-compartment model, the change in BBP concentration in the assay medium (Cmedium) and in PDMS (CPDMS) can be expressed by:
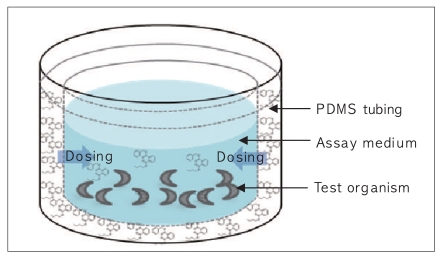
Schematic representation of the passive dosing system for C. elegans bioassay.
PDMS: polydimethylsiloxane.
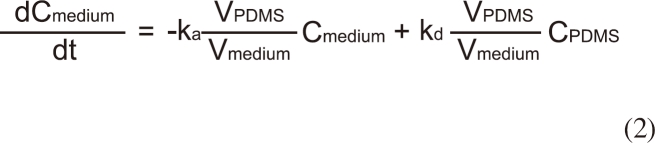

where ka is the absorption rate constant (Lmedium LPDMS h-1), kd is the desorption rate constant (h-1), and VPDMS and Vmedium are the volumes (L) of PDMS and the medium, respectively.
The analytical solution for Cmedium of the above differential equations is given by [7]:
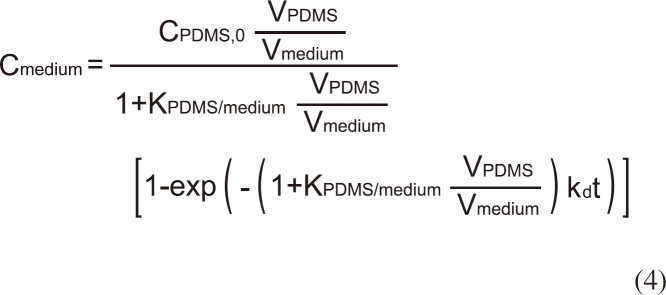
where KPDMS/medium is the partition coefficient of BBP between PDMS and the assay medium, CPDMS,0 is the initial concentration of BBP in PDMS. Because KPDMS/medium is sufficiently high for BBP, it is reasonable to assume that the loss of BBP from the PDMS dosing phase during the experiment via delivery to the assay medium, sorption to the wall of the plate, or volatilization is negligible. By measuring Cmedium at 0.083, 0.167, 0.33, 0.75, 1, 1.5, 2, 4, 10, 24, and 40 hours after the exposure to the PDMS dosing phase, values of KPDMS/medium and kd were obtained using a non-linear regression (Equation 4) using Graphpad Prism 3.0 (La Jolla, CA, USA).
IV. Modeling the Effects of Geometry
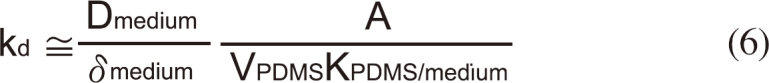
Desorption constant (kd) in equation 4 can be estimated using a film diffusion model as follows:
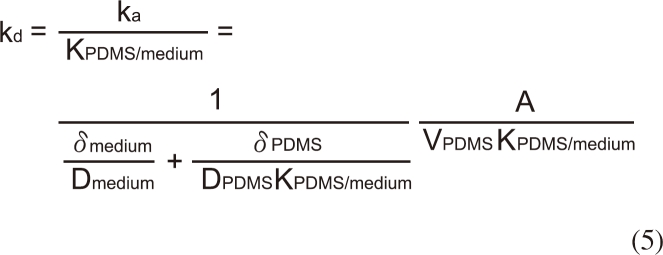
where Dmedium and DPDMS are the molecular diffusion coefficients of the solute in the medium and in the PDMS, δmedium and δPDMS are the thicknesses of the diffusion film in the medium and in the PDMS tubing, and A is the interface area between two phases. The resistance term in the assay medium is known to be much higher than in the PDMS dosing phase for highly hydrophobic chemicals such as BBP [7,9] due to high permeability of PDMS to organic chemicals [11], it is reasonable to simplify equation 5 neglecting the effects of the mass transfer resistance in PDMS side.
Because the assay medium used in this study can be regarded as water neglecting the effects of ionic strength (I=0.083 M), the molecular diffusivity can be estimated from the molecular weight (MW) of BBP [12]:

Thus, the thickness of the mass transport boundary layer of the medium (δmedium) can be estimated with the measured kd value.
V. C. elegans Mortality Test
Prior to the toxicity test, organisms were prepared. The wildtype C. elegans Bristol strain N2 was used. C. elegans (Caenorhabditis Genetics Center, USA) were maintained on nematode growth medium (NGM) plates seeded with Echerichia coli strain OP50, at 20℃, using the standard method [13].
Acute mortality tests of BBP using C. elegans were conducted both using passive dosing and a conventional spiking method. For passive dosing, PDMS tubings loaded with desired concentrations of BBP as described earlier were placed in individual wells of 24-well plate containing the assay medium. The medium was exposed to PDMS tubings for 2 hours in an incubator at 20℃ to reach the equilibrium between the PDMS tubing and the solution. Approximately ten organisms were then added to the medium and live organisms were counted after 24 hours. For a comparative evaluation, BBP was spiked into the medium as dissolved in DMSO to prepare nominal concentrations of 0.3, 1, 3, 10, 30, and 100 mg/L. The concentration of DMSO was less than 0.1% (v/v) in the final solution. All experiments were conducted with three replicate wells for each concentration.
After 24 hours acute mortality test, approximately 0.5 mL medium was carefully taken and transferred to a glass vial to chek the equilibrium concentration of BBP in the medium. The sampled medium was directly subjected to HPLC quantification.
VI. Instrumental Analyses
The concentration of BBP was quantified using an HPLC system equipped with Waters 600E pump (Milford, MA, USA), an autosampler (Waters 717+), and a UV detector (Waters 996). Deionized water:methanol (2:8) was used as an eluent in an isocratic mode with the flow rate of 1 mL/min. BBP was separated on a Thermo C18 column (4.6 × 150 mm, 5 µm particle size; Thermo Scientific) and detected at 230 nm.
RESULTS
I. Loading BBP to PDMS
Figure 2 shows the relationship between the concentration in the PDMS tubing and the loading solution in three concentration. The partition coefficient between PDMS and the loading solution (KPDMS/loading-solution) was determined 4.05±0.09 from the slope of the regression. This value was then used for the calculation of the initial concentration of BBP in PDMS after loading without measuring concentration of BBP in individual PDMS tubings.
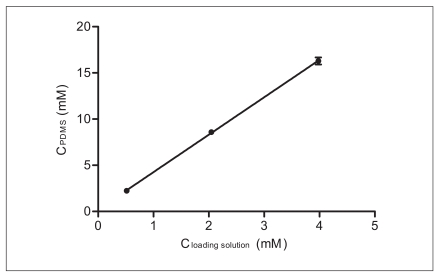
Relationship between CPDMS and Cloading solution for the determination of partition coefficient. Error bars denote standard deviations. The coefficient of linear regression (r2) was 0.999.
PDMS: polydimethylsiloxane.
II. Release of BBP from PDMS
Figure 3 shows the release of BBP from PDMS tubing to the assay medium with the solid line representing the model fit using equation 4. The desorption rate constant (±standard error [SE]) and KPDMS/medium (±SE) were 1.53 (±0.18) × 10-4/h and 9,073 (±369), respectively. Time to reach 95% steady state was estimated 2.2 hours. Because the test duration of the mortality test using C. elegans was 24 hours, it is likely that a constant exposure condition was maintained during the test.
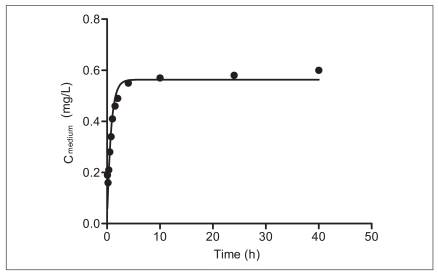
Change in concentration of BBP in medium assay. Data were fit to equation 4 to determine kd and KPDMS/medium.
BBP: benzyl butyl phthalate, PDMS: polydimethylsiloxane.
The effective thickness of the diffusion boundary layer in the medium (δmedium) was estimated as 0.4 mm using equation 6 with the experimentally obtained kd value. The thickness of the unstirred water layer under non-agitated systems with different geometry has been reported approximately between 0.15 and 2.0 mm [14,15]. For an agitated system, it might decrease to less than 1 µm [16]. The value obtained in this study is slightly lower but approximately fall in the range reported in the literature.
III. Acute Toxicity of BBP to C. elegans
Mortality of C. elegans was not observed for all doses tested regardless of the administration methods of BBP to the medium (Table 1). Because the maximum dose used in this study was as high as the limit of the solubility of BBP, 2.7 mg/L [17], it is likely that acute effects on C. elegans are not expected due to the exposure to BBP under any conditions.
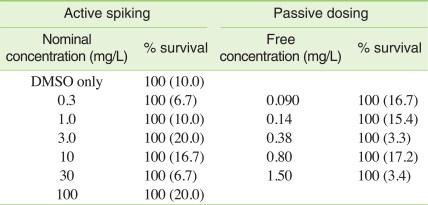
Survival of C. elegans at different concentrations of BBP administered by both active spiking and passive dosing
IV. Comparison of the Two Dosing Methods
Because BBP is delivered from a PDMS tubing, the maximum concentration in the medium cannot exceed the solubility in the medium. Figure 4 describes the measured BBP concentration in the medium after the mortality tests versus the intended concentration by the passive dosing method and the spiking method. The calculated values in the medium using KPDMS/medium agreed well with the measured free concentration when BBP was administered using the passive dosing method. However, the discrepancy between the nominal concentration and the measured free concentration dramatically increased as the nominal concentration exceeded the solubility of BBP in water.

Due to the limited volume of test organisms used in this study, it was not possible to extract BBP from the organism and quantify the body-residue concentration to make sure that the equilibrium is obtained. Instead, it was checked that the concentration of BBP in the medium measured after the exposure agreed with the predicted values from the partition coefficient.
DISCUSSION
I. Advantages of Passive Dosing
As shown in Figure 2 and Figure 4, the passive dosing method developed in this study was suitable for providing well-defined exposure condition for BBP and superior to active spiking methods. Although the prediction of the aqueous exposure concentration requires the pre-determined KPDMS/medium, the free concentration in the medium can be well maintened once the KPDMS/medium is known.
II. Extension to High-Throughput Screening Tests
Based on the maginitude of the unstirred water boundary layer, time required to reach steady-state using different high-throughput platforms could be estimated. Figure 5 shows model calculation of the desorption kinetics of a hypothetic hydrophobic chemical (MW = 312.4 g/mol, Dmedium = 1.65 × 10⁻⁶ m/h, KPDMS/medium = 9073). The conventional test conditions were estimated as shown in Table 2. As shown in Figure 5, 95% steady-state was obtained within 6 hours in a 6-well plate in which the equilibration time is the longest under the assumptions listed in Table 2. This simulation indicates that the passive dosing technique used in this study is very promising for maintaining constant exposure for high-throughput toxicity testings. In addition, it should be also noted that a slight agitation makes the unstirred water layer much thinner than modeled in this study and the resulting equilibration time can be much shorter.
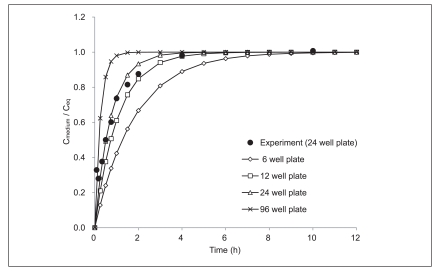
Desorption kinetics of a hypothetic hydrophobic chemical modeled by the estimated kd values using equation 5 in various conditions.
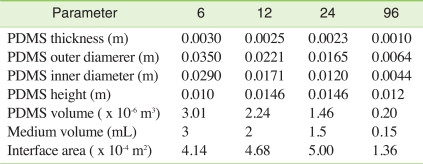
The conventional test conditions of acute toxicity test in various types of micro well-plates
III. Bioturbation and Absorption by Organisms
The presence of organisms in the medium may slow the equilibration time. However, the total mass of C. elegans in the medium is less than 10-4 g estimated from the size of the organisms with the asumption of unit density. This is too small mass to affect the overall desorption kinetics considering KPDMS/medium value of 9073. The lipid content of C. elegans was reported approximaely 20% dry weight [18]. Thus, it is still reasonable that the exchange of BBP between C. elegans and the medium is much faster than the release from PDMS. In addition, it is likely that the motion of C. elegans in the medium (i.e., bioturbation) decreases the thickness of the unstirred water layer although the effects could not be quantified. Considering all these aspects together, well-defined exposure condition is highly likely to be maintained in the passive dosing method used.
IV. Toxicity of BBP to Invertebrates
A recent toxicity study for BBP using invertebrates showed that LC50 values were 0.46 and 1.23 mg/L for Hyalella azteca and Lumbriculus variegatus in a 10-day water only exposure test, indicating that the toxicity of BBP could be observed below the water solubility [19]. Because BBP is liquid in an ambient temperature, the expected chemical activity in the body (or the body-residue concentration) is likely to exceed the level causing baseline toxicity [20,21]. Thus, the non-observed toxicity of BBP in C. elegans may be due to the metabolic transformation of BBP although it needs further research.
Some recent studies still reported the acute toxicity of BBP even at the nominal concentration greater than the solubility in the medium. For example, Planello et al. [22] reported LC50 of 26.6 mg/L in a survival test for lavae of Chironomus riparius. This value obviously exceeds the limit of free concentration in the aqueous phase as shown in this study. Because overwelming assumption in ecotoxicology is that only freely available fraction penetrates the cell membrane and thus results in any toxic responses, it is very difficult to interprete those results without knowing well-defined exposure conditions. Incremental change in response is usually observed with increasing dose of a chemical at the level greater than its solubility in the assay medium. Two possibilities are that (1) the increasing nominal concentration still steadily increased the internal concentration (as shown in Figure 4) and thus toxic effects became apparent with the increasing free concentration and that (2) complicated interactions with co-solvents administered with the test substances in test organisms may result in a synergystic toxicity. For the evaluation of those hypotheses, further investigation is needed.
CONCLUSION
A stable exposure condition for a high-throughput acute toxicity test can be provided using passive dosing. Model simulation also showed that the method can be used for other high-throughput assay platforms. Because well-defined exposure condition is easily maintained in a passive dosing method, more reliable toxicity assessment can be made for hydrophobic chemicals.
ACKNOWLEDGEMENTS
This work was supported by Basic Science Research Program through the National Research Foundation of Korea (NRF) grant funded by the Korean Government (MEST) (grant number 2009-0065352).
Notes
The authors have no conflict of interest to declare on this study.
This article is available from: http://e-eht.org/