Relationship between PAHs Concentrations in Ambient Air and Deposited on Pine Needles
Article information
Abstract
Objectives
This study was carried out to determine whether or not pine needles can be used as passive samplers of atmospheric polycyclic aromatic hydrocarbons (PAHs) using the correlation between accumulated PAH concentrations in air (Ca, ng/m3) and those deposited on pine needles (Cp, ng/g dry).
Methods
PAHs in ambient air was collected using low volume PUF sampler and pine needles was gathered at same place for 7 months.
Results
good correlation (R2=0.8582, p<0.05) was found between Ca and Cp for PAHs with a higher gaseous state in air (AcPy, Acp, Flu, Phen, Ant, Flt, Pyr, BaA and Chry), but there was a poorer correlation (R2=0.1491, p=0.5123) for the PAHs with a lower gaseous state (BbF, BkF, BaP, DahA, BghiP and Ind123). A positive correlation (R2=0.8542) was revealed between the logarithm of the octanol-air partitioning coefficient (logKoa) and Cp/Ca for the PAHs with a higher gaseous state in air, but there was a negative correlation (R2=0.8131) for the PAHs with a lower gaseous state. The Ca-Cp model could not be used to estimate PAHs concentrations in air using deposited PAHs concentrations on pine needles, but the logKoa-Cp/Ca model could be used.
Conclusions
It was found that pine needles can be used as passive samplers of atmospheric PAHs.
INTRODUCTION
Persistent organic pollutants (POPs) such as polycyclic aromatic hydrocarbons (PAHs), polychlorinated dibenzo-p-dioxins (PCDD/Fs) and polychlorinated biphenyls (PCBs) migrate long distances through the atmosphere. In the case of rainfall or when the temperature goes down they form dry or wet deposits on plants, soil and in the hydrosphere from the atmosphere, but when the temperature goes up, they volatilize into the atmosphere from these environmental media. Knowing the concentrations of PAHs and POPs is important for understanding their circulation with in the environment [1].
In order to calculate the concentrations of PAHs and POPs in the atmosphere, polyurethane foam (PUF hereinafter) samplers have traditionally been used to collect samples, but not only does the PUF sampler have high costs, a source of electricity is also necessary for its operation. The PUF sampler is difficult to use in regions where atmospheric samples need to be collected simultaneously or where there is no source of electricity. Due to these problems, passive sampler is a very convenient tool for sampling in cases where simultaneous collects in multiple places are required or in isolated regions where electricity is not provided [2-8].
Up until now, tree leaves, tree bark, moss and soil have mostly been used as passive samplers of PAHs and POPs within the atmosphere [3,6,9-18]. However, calculating the concentration of PAHs and POPs within the atmosphere from deposits on tree leaves, tree bark, moss and soil, has lots of constraints because of difficulties such as the wind velocity effect, photodegradation due to ultraviolet rays, and difficulties in time exposure assessments [3,19,20]. Due to these constraints, scientists calculate the atmospheric concentrations of PAHs and POPs through passive samplers, which have recently been developed to reduce the repercussions caused by wind and photodegradation by inserting PUF, XAD-2 and SPMD (semipermeable membrane device) in the shelter [2,7,8]. Even though it is not as costly a piece of equipment as the PUF sampler is, this passive sampler is troublesome to use because its manufacturing cost is high, the absorbent needs to be rinsed out before collecting sample, and the user is responsible for the installation and removal of the samplers. However, in the bio-monitoring method, which uses passive samplers such as tree leaves, tree bark, moss and soil, it is difficult to calculate the exact PAHs and POPs concent-rations. The bio-monitoring method is very convenient and economical because there are no preparatory steps such as shelter installation or rinsing out of the absorbent and because it is possible to collect the samples anywhere; therefore, it is very useful when simply comparing PAHs and POPs concentrations according to regions.
Pine tree grow in the wild in many regions across the world. Their sampling is easy and many researchers use them in their research because the pine needle sample is more compatible than samples from other species of trees. Pine needles have more wax on their cuticles, thus lipophilic PAHs and POPs are easily deposited on them. Pine needles are used as passive samples the most because pine trees are perennial, and the PAHs and POPs in the air accumulate and deposit on the leaves. Thus, scientists can use information on the change of PAHs and POPs concentrations over the long term, and sampling is even possible in winter because pine trees are evergreen [3-6,11,12,16-18,21,22].
Gaseous PAHs and POPs in the air maintain a balance as they deposit themselves onto plant leaves when there is a high concentration, and they volatilize into the air when there is a low concentration [10,23-25]. However, because of the different tree and leaf structures, the characteristics under which the PAHs and POPs are deposited or volatilized into the atmosphere differ when different trees or leaves are compared [21]. Therefore, it is very likely that researchers will come to different conclusions if they apply the research results of PAHs and POPs deposited on normal plant leaves or tree leaves. In order to use pine leaves as a passive sampler a close examination of the characteristics of deposition of PAHs and POPs in fixed quantities on pine trees should first be performed. However, up until now, the characteristics of PAHs and POPs deposited on pine needles have only been researched through their concentrations on pine needles without calculating the concentration of PAHs and POPs in the air, thus making it difficult to determine whether or not the concentrations of PAHs and POPs found on the pine needles reflected the concentrations of PAHs and POPs in the air [3-6,20-22].
By measuring PAHs both in the air and in the pine needles simultaneously, this research aimed to closely examine whether or not pine needles can be used as passive samplers of PAHs in the air, and to develop a model which would allow researchers to predict the concentration of PAHs in the air using PAHs concentrations in pine needles.
MATERIALS AND METHODS
I. Reagent Chemicals
Internal surrogate standards (naphthalene-d8, acenaphtalene-d10, anthracene-d10, chrysene-d12, perylene-d12) and a recoverysurrogate standard (4,4'-dibromooctafluorobiphenyl) were purchased from Spelco (Bellefonte, PA, USA); dichloromethane (DCM) was used as a solvent, and HPLC grade n-hexane (J.T.Baker, Philipsburg, NJ, USA) was used after distillation. Na2SO4 (anhydrous granular, Shinyo Pure Chemical, Osaska, Japan), SiO2 (70-230 mesh ASTM Merck, Darmstadt, Germany) and Al2O3 (70-230 mesh ASTM Merck, active basic, Darmstadt, Germany) were activated by heating in the oven at 130℃ for more than 24 hours. The researcher used bio-bead called S-X3, 40-80 µm of Bio Rad (Hercules, CA, USA), and the PAHs calibration standard used for analysis was purchased from Supelco's 16 PAHs and mixture (EPA 610 PAHs mix, Bellefonte, PA, USA). Table 1 displays the kinds of PAHs, their abbreviations, and their physical and chemical character-istics.
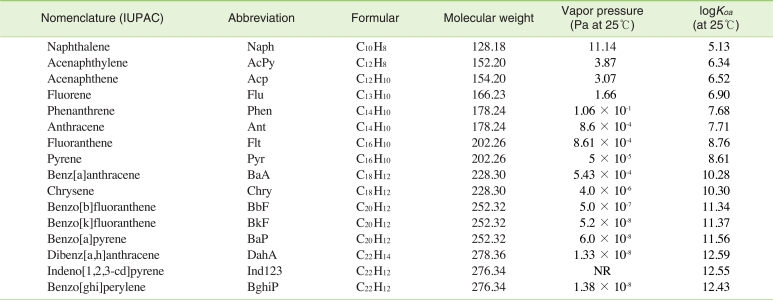
Nomenclatures and physicochemical properties of 16 PAHs analysed in this study
II. Sampling
The air sampling was taken at the rooftop of the second engineering building (a four-storey building) of Hankyung National University, located at Ansung, Kyonggido. Two PUF samplers (5×6.5cm, Klaus Ziemer Gmbh, Germany) were placed into glass tubes inseries and, using the volume PUF sampler at 1 hour intervals, the on-off switch was turned to the speed of 20-30 L/min in halation flux. Regarding the total absorption capacity of the PUF, particulate and gaseous PAHs were sampled simultaneously with a total flux of 600-700 m3 each month. Two 3-year-old pine trees (Pinuskoraiensis) at a height of 1 m were placed in pots next to the 2-3 m PUF sampler to take samples. The pine needles took three months to achieve its full growth and sprouting occurred at the beginning of June; thus, the pine needles were collected at the end of August. Air samples were collected at the same time as the pine needles were exposed to the air, and they were collected while replacing new PUF samplers each month, considering the absorption capacity of the PUF.
III. Extraction and Sample Drying
Pine needles were collected from the two pine trees and combined; 5 g were taken from each tree (with two duplicates) and the PAHs were extracted with DCM for 24 hours using Soxhlet apparatus. Two samples were simultaneously collected using the PUF sampler and analyzed immediately after collecting the samples from the DCM after 24 hours. After drying 10 g of a wet sample for more than 24 hours at 95℃, the dried sample was weighed to determine the change in weight.
IV. Pre-Treatment
A) Silica-alumina column
The PAHs extract using the Soxhlet apparatus was concentrated to approximately 2-3 mL in the rotary evaporator. Inside the glass column, which had a diameter of 11 mm and a length of 230 mm, 2.5 g Al2O3, 1.5 g SiO2, and approximately 2 g anhydrous Na2SO4 were placed, in that order, and then activated by heating in the oven at 130℃ for more than 24 hours, before being cooled to the normal temperature. Afterwards, the column was rinsed out with 70 mL of n-hexane:DCM (1:1), the concentrated sample was inserted, and then the deterrents were removed using the eluted 70 mL of n-hexane:DCM (1:1).
B) The GPC Column
The deterrents in the sample could not be completely removed using only the silica-alumina column, thus the sample was purified again using the GPC (gel permeation chromatography) column that measured 20 mm in diameter and 220 mm in length and was filled with 12 g of bio-beads. The extraction solvent for the silica-alumina column was concentrated to approximately 1 mL in the rotary evaporator. Then, the solvent was placed into the GPC column that had been rinsed out with 100 mL of mixed n-hexane:DCM (1:1) and then eluted with 80 mL of n-hexane:DCM (1:1). The first 37 mL of extract was discarded because it contained deterrents and the remaining 43 mL was used to analyze the fractions of PAHs.
V. Analysis
The GPC column with PAHs fraction was concentrated inside the rotary evaporator to approximately 1-2 mL, and transferred to 10 mL vial via a quantitative method. The 50 µL n-nonane was added as a keeper along with the recovery surrogate standard (4,4'-dibromooctafluorobiphenyl). They were slowly concentrated with nitrogen on the hot plate to about 50 µL and then analyzed through GC-MS. Table 2 displays the GC-MS analysis conditions.
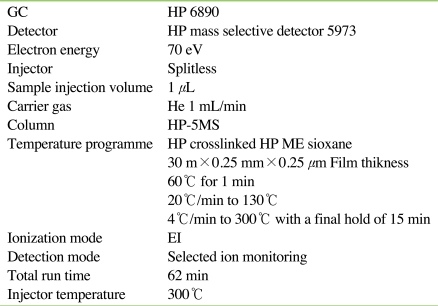
Analytical conditions of GC-MS for PAHs determination
VI. QA/QC
Regarding the quantity of PAHs, only those with a chromatographic height three or more times greater than the noise were included in the fixed quantity. After evaluating every recovery rate for the pre-treatment process using five kinds of deuterated PAHs as internal surrogate standards for refining purposes, it was found that the recovery rate was 42.5-105.1% (n=6). The coefficient of variation (CV) was 5.3-14.8% and the smaller the molecular weight, the lower the recovery rate and higher the CV. Two duplicates were made and analyzed for each sample, and the CV of the two samples was 3.5-34.2%; naphthalene was not included in this calculation because the peak of the blank was too high. This study used the average concentration from the two samples.
RESULTS
Figure 1 shows the accumulated PAH concentrations (Ca, ng/m3) and the PAHs (Cp, ng/g dry) deposited on pine needles that were simultaneously exposed to air. According to the results of Baek and Choi [28], the gaseous PAHs fractionin the air decreased as the molecular weight increased and the particle fraction increased. The gaseous fractions of AcPy, Acp, Flu, Phen, Ant, Flt, Pyr, BaA, and Chry were high, at 100-56.9%, and the gaseous fractions of BbF, BkF, BaP, DahA, BghiP and Ind123 were low, at 11.1-0.0%. In this research, the regression line for the coefficient of crystallization (R2) between Ca and Cp of the PAHs with high gaseous fractions showed a high correlation of 0.8582 (p<0.05), but the regression line for the coefficient of crystallization (R2) between Ca and Cp of PAHs with high gaseous fractions showed a low correlation of 0.1491 (p=0.5123).

PAHs concentrations in pine needles (Cp) and ambient air (Ca).
DISCUSSION
I. Correlation between PAHs in the Air and in Pine Needles
The PAHs and POPs in a gaseous form in the air become deposited on plant leaves when at a high concentration in the air, and they volatilize into the air from leaves when they are at a low concentration in the air. A balance is maintained between the concentrations of PAHs and POPs, and a new leaf maintains this balance for two weeks [23-25]. Compared to other tree leaves or plant leaves, pine needles have more resin channels that lead to the insides of the leaf from the outside, which allow gaseous PAHs and POPs to deposit inside the leaves. Even when the concentration of POPs and PAHs decreases, a cumulative deposition happens inside the pine needles because the emission rate of concentration from the inside to the outside is late. However, because of their large molecular weight, PAHs existing in the particle state only stick to the surface of pine needles without moving inside, thus a cumulative deposition does not happen. The pine needle samples used for this research had been exposed to the air for three months; therefore, it was assumed that a cumulative deposition occurred for the gaseous PAHs but not for the particulate PAHs. Thus, it was estimated that there was a high correlation between the cumulative concentration of the PAHs in the air and the concentration of PAHs deposited on the pine needles for the high gaseous fractions, but a low correlation between the cumulative concentration of the PAHs in the air and the concentration of PAHs deposited on the pine needles of the low gaseous fractions. The concentration of low gaseous fraction PAHs in the air was not high; they do exist in the gaseous form, which allows cumulative deposits on the pine needles, but because the concentration of these cumulative deposits is small, it did not affect the correlation between Ca and Cp.
Where pine needles are used as a passive sampler to measure semi-volatile organic compounds (SOCs) with gaseous and particle phases coexisting in the air, like PAHs, the problem of a low correlation resulting from the fact that the gaseous phase cumulatively deposits on the leaves but the particle phase does not can be solved by using young leaves which not have deposits of the gaseous form. There are plants such as the chives or rye grass where the young leaves grow large enough to be used as samples after two weeks, but pine needles do not grow again once they have been cut and pine needles two weeks old after the sprout are too small to be used as samples. Also, in cases where two-week-old pine needles have to be used as samples, it is difficult to match the time of sample collection to the exact point, thus one could conclude that these pine needles are inappropriate for using as passive samplers. Therefore, despite the problem with cumulative deposition, this study used fully-grown leaves that had been exposed to the atmosphere for three months after sprouting.
As mentioned in the introduction earlier, pine leaves have many strong points as passive samplers of PAHs. However, because gaseous PAHs cumulatively deposit on pine leaves and particulate PAHs do not, the Cp-Ca model is in appropriate for determining PAHs concentrations in the air.
II. Correlation of logKoa-Cp/Ca
Because PAHs are lipophilic, when PAHs in the air become deposited onto the wax spread across pine needles, they rely heavily on their octanol-air partitioning coefficient (Koa). As Table 1 shows, the logKoa of PAHs increases as the molecule gets larger, and as the logKoa increases it becomes easy for the PAHs in the air to accumulate on the pine needle wax [25-27]. Also, the main route by which PAHs and POPs travel from the air to the leaves is through a dry deposition process [29]. However, the larger the molecular weight, the lower the gaseous fraction in the air and the higher the particulate fraction [28].
Figure 2 shows the relationship between logKoa and Cp/Ca. As the figure shows, logKoa increases as the molecular weight of the PAHs increases, but Cp/Ca showed a tendency to increase for PAHs with high gaseous fractions in the air (AcPy, Acp, Flu, Phen, Ant, Flt, Pyr, BaA, and Chry) and to decrease for PAHs with low gaseous fractions in the air (BbF, BkF, BaP, DahA, BghiP and Ind123). Thus, it can be concluded that the PAHs with high gaseous fractions in the air have a bigger logKoa as the molecular weight increases, thus the concentration at which these PAHs become deposited on the pine trees is high, leading to a high Cp/Ca. It can also be concluded that the PAHs with a low gaseous fraction in the air have a high logKoa as the molecular weight increases, but also that they have a low Cp/Ca because the PAHs concentration deposited on the pine trees decreases.
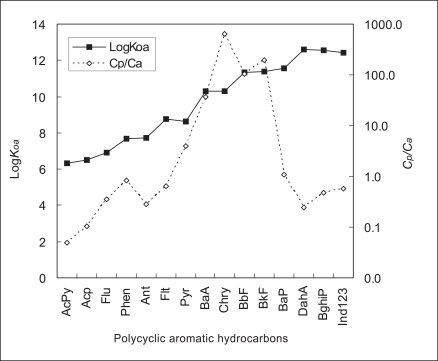
Ratio of PAHs concentrations in pine needles to air (Cp/Ca) and logKoa.
Figure 3 shows the correlation between logKoa and Cp/Ca for each PAHs; (a) PAHs (AcPy-Chry) with high gaseous fractions in the air, and (b) PAHs (BbF-Ind123) with low gaseous fractions in the air, including Chry, which is an inflection point. As the picture shows, the PAHs with high gaseous fractions showed a positive correlation (R2=0.8542) and the PAHs with low gaseous fractions showed a negative correlation (R2=0.8131). The reason for the high correlation between the logKoa and Cp/Ca for both high and low gaseous fractions is because logKoa reflects Cp/Ca very well.
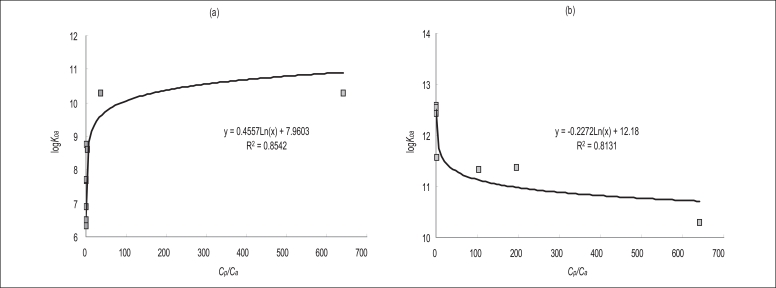
Relationship between the logKoa of the PAHs and the ratio of concentrations in pine needles to air (Cp/Ca) (a) AcPy, Acp, Flu, Phen, Ant, Flt, Pyr, BaA and Chry; (b) Chry, BbF, BkF, BaP, DahA, BghiP and Ind123.
CONCLUSION
The aim of this research was to simultaneously measure the accumulated concentration (Ca, ng/m3) of PAHs in the air and the accumulated concentration in pine needles (Cp, ng/g dry) to closely examine the correlation between the two concentration levels and to determine whether PAHs in the air can be used as passive samplers.
The PAHs with high gaseous fractions in the air (AcPy, Acp, Flu, Phen, Ant, Flt, Pyr, BaA, and Chry) showed a high correlation between Cp and Ca (R2=0.8582, p<0.05). However, the PAHs with low gaseous fractions in the air (BbF, BkF, BaP, DahA, BghiP and Ind123) showed a low correlation between Cp and Ca (R2=0.1491, p=0.5123). The logarithrn of the octanol-air patritioning coefficient (logKoa) and the Cp/Ca showed apositive correlation (R2=0.8542) in the case of PAHs with high gaseous fractions, and a negative correlation (R2=0.8131) in the case of PAHs with a low gaseous fraction. It was found that the Cp-Ca model was unsuitable for determining PAHs concentrations in the air, but the logKoa-Cp/Ca model was suitable; therefore, it is possible to conclude that pine needles can be used as passive samplers of PAHs in the air.
Notes
This article is available from: http://e-eht.org/