


Introduction
Indiscriminate disposal of used engine oil in the environment is considered one of the most potent sources of environmental pollution [1]. The regular use of petroleum-based products like gasoline, diesel, fuel, engine oil and lubricating oil particularly in automobile mechanic villages (MVs) most often results in extensive and inevitable spillage of most of these products in the environment [2]. Motor vehicle and miscellaneous assembly wastes generated in the MVs during maintenance, repairment or dismantling of motor vehicle parts are usually not properly managed during disposal [3]. The artisans in the business of auto-repairs often dump or spill used engine oils, lubricating oils and other solvents containing petroleum hydrocarbons (PHs) on available space (Figure 1) within their workshops [4]. These spent oils and solvents are among the potentially hazardous wastes often generated in auto-repair workshops in most Nigerian cities [3,5]. The used engine oil contains a mixture of chemicals which include PHs, chlorinated biphenyls, and additives as well as decomposition products and heavy metals resulting from wearing of the engine parts [2,4]. These categories of wastes in addition to oil filters, scrap metal parts, lead batteries, and abandoned vehicles which are indiscriminately disposed of are resistant to biodegradation [6]. The presence of these environmental pollutants most often result in the buildup of heavy metals in the soil which may finally find their way into the plant tissues [7]. Also, the migration of the spent oil and percolation of leachates from the materials contained in the oil poses serious threats to the surface and groundwater quality [8–10].
The implication of heavy metals, as well as polycyclic aromatic hydrocarbons (PAHs) and PHs in the environment, is increasingly becoming an issue of global concern especially as the soil makes up an important aspect of the rural and urban environment [11,12]. Oil increases the levels of heavy metals in the soil [13], and as a result of its hydrophobic nature, oil reduces water infiltration into the soil. Several earlier reports revealed that human exposure to elevated concentration of heavy metals particularly children may result in several illnesses such as kidney and liver damage, paralysis, convulsion, depression, and pneumonia [14–16]. Other effects of heavy metals on human health have been reported in several key publications [10,16–18].
Reports on the impact of petroleum products on soils around automobile workshops in Osun State, Nigeria revealed that in addition to the fact that the soil samples were acidic, the concentrations of cadmium (Cd) and lead (Pb) also exceeded the baseline levels [19]. Obini et al. [20] reported high levels of PAHs in soils contaminated with spent motor engine oil in the Abakaliki MV. An assessment of heavy metal contamination in soils within auto-mechanic workshops at Ikare Akoko MV showed remarkably high levels of all the metals such as nickel (Ni), copper (Cu), iron (Fe), chromium (Cr), and Cd above background concentrations [9]. Similarly, the result of heavy metal contamination in soil and water at automobile junk markets in Obosi and Nnewi, Nigeria revealed elevated manganese (Mn), Cr, Cu, Fe, Ni, Pb, and zinc (Zn) above background levels in water and soil [21].
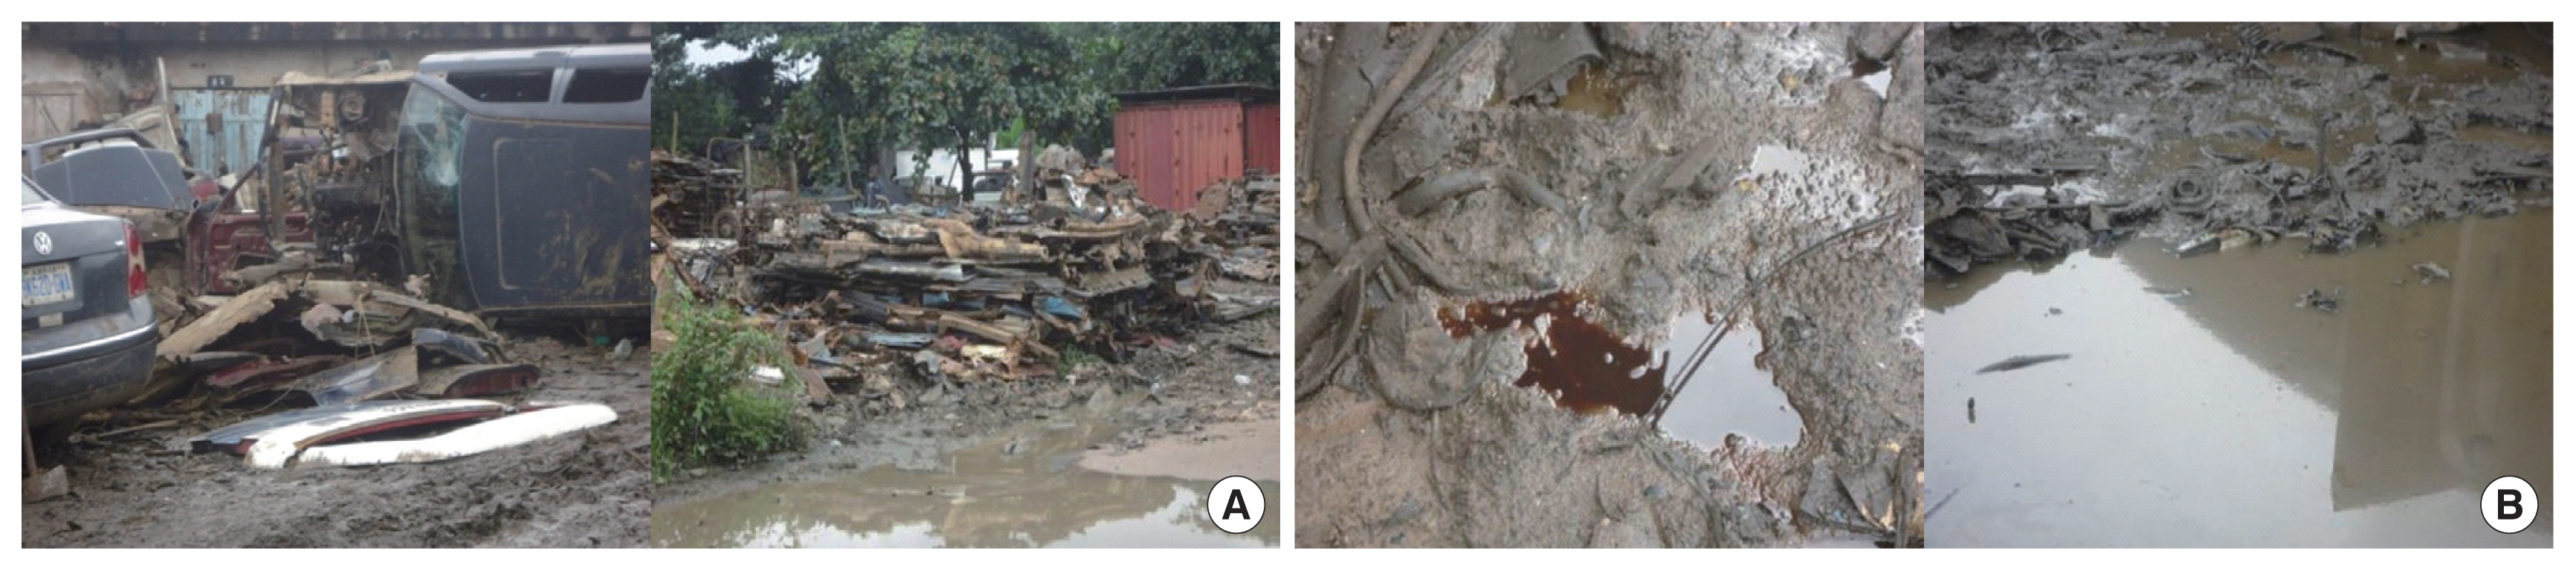
Therefore, there is an urgent need to regularly assess the impact of automobile mechanic workshops on the environment. The need for monitoring and assessment has become necessary as there could be severe contamination of the surrounding air, surface water, groundwater, soil, and river sediments [10,22–24]. Environmental contamination may result from heavy metals, such as Cd, Cu, and Pb, as well as organic contaminants, like PAHs, polychlorinated biphenyls (PCBs), and poly-brominated diphenyl ethers (PBDEs) [25,26]. There is an urgent need to monitor the activities at Alaoji Aba and Elekahia Port Harcourt MVs after more than thirty years of their operation. Besides, there is the need to regularly assess the geo-environmental effect of these activities as there is a paucity of data on the two MVs. This study has the objectives of determining the concentrations of heavy metals such as Pb, Cd, and Cr, total petroleum hydrocarbon (TPH) and PAHs in soil samples from Alaoji Aba and Elekahia Port Harcourt MVs. The result of the heavy metal analysis will be further subjected to pollution index models for health and environmental risk assessment.
Materials and Methods
Location and background geology of the study area
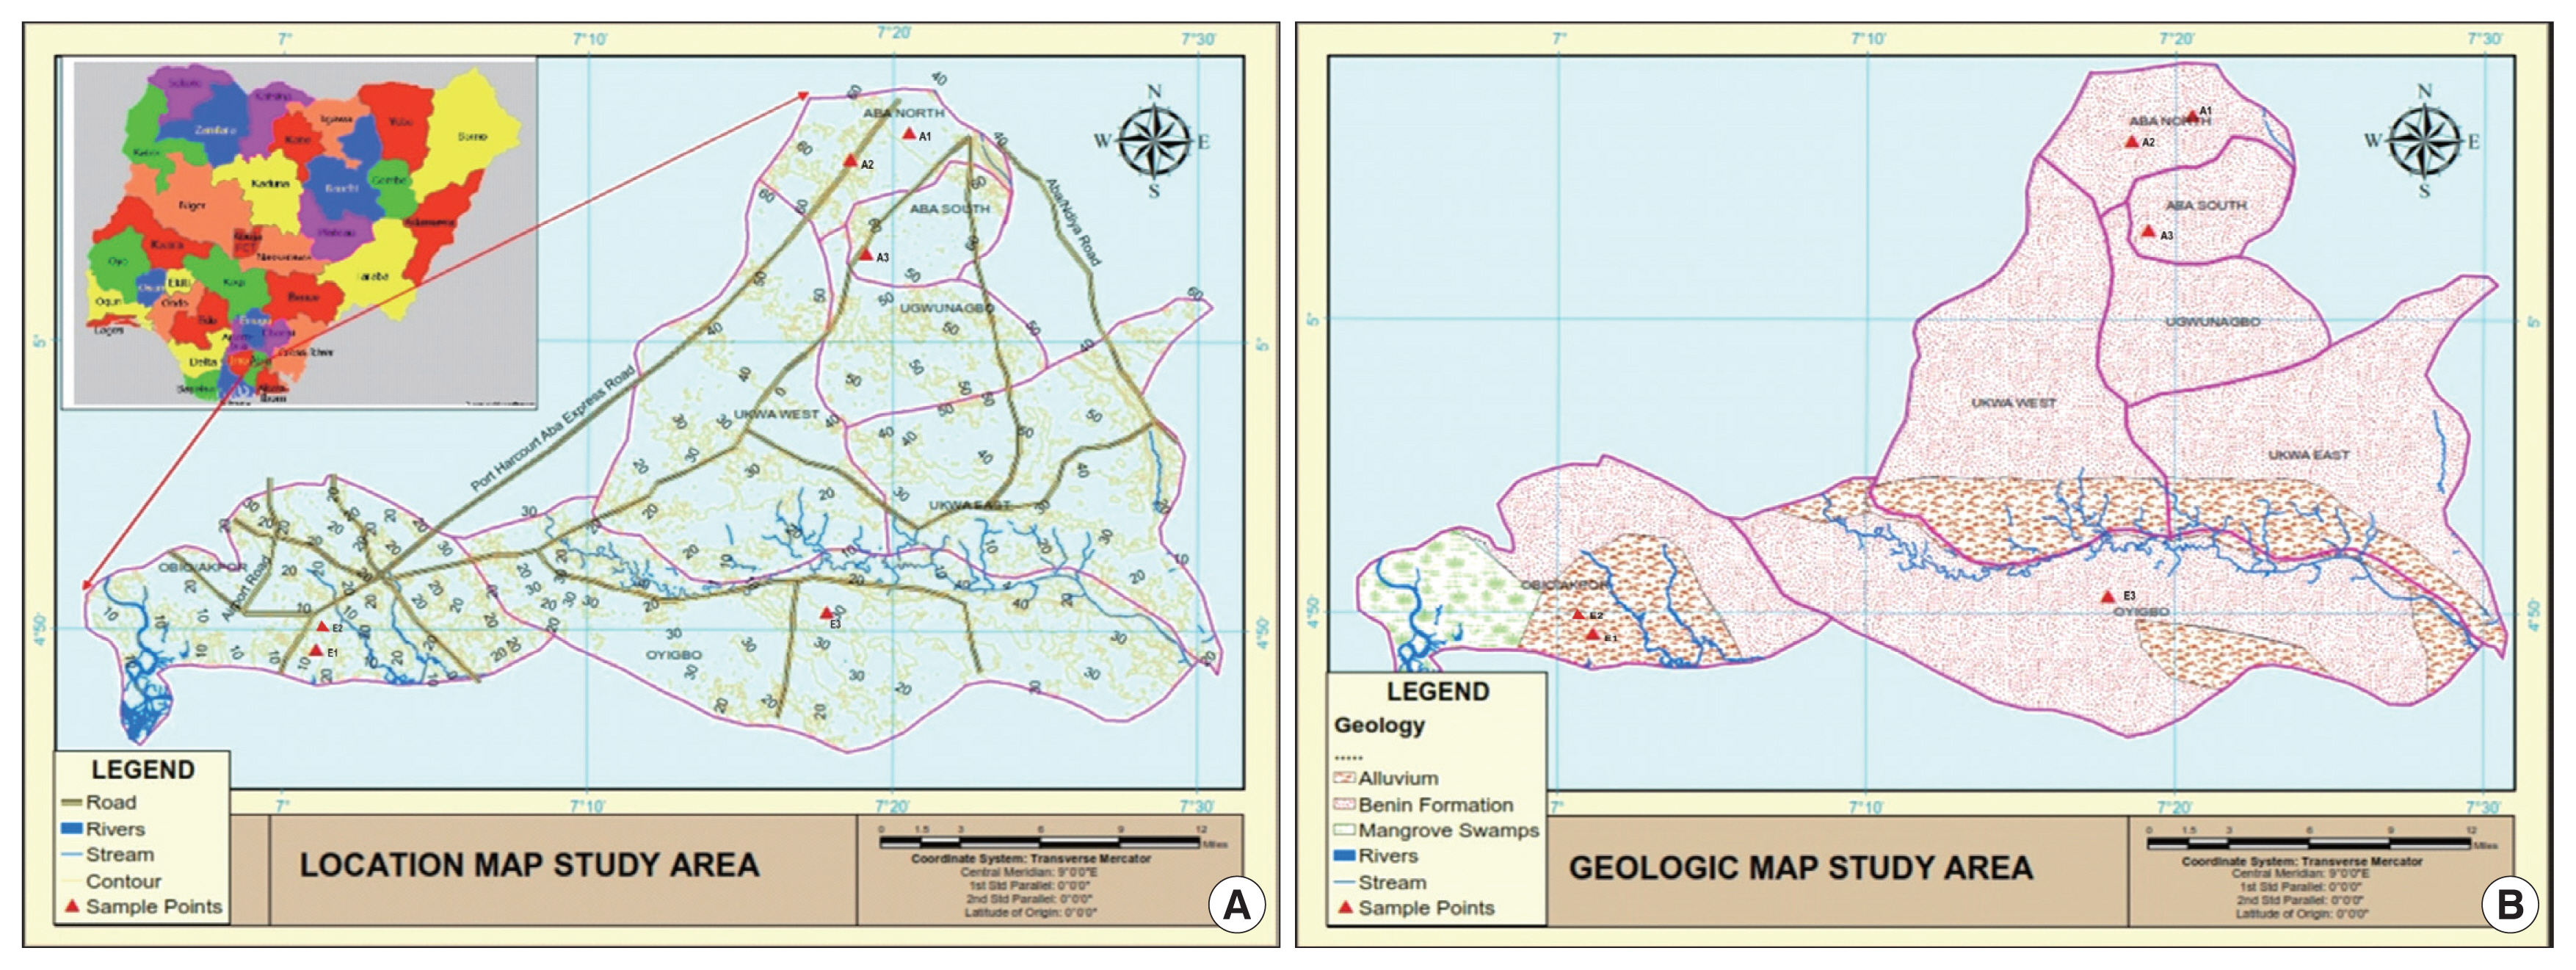
The study area lies between longitudes 7°00′ and 7°30′ E and latitudes 4°40′ and 5°10′ N. It covers parts of two major cities of the Niger Delta region in Nigeria; the Alaoji MV in Aba, Abia State and the Elekahia MV in Port Harcourt, River State as shown in Figure 2A. The study area is within the sub-equatorial climatic belt characterized by two major seasons, the wet and dry seasons. The wet season generally starts in April and ends in September with peaks in June and July, while the dry season lasts from October to March. However, recent global climate change has affected the duration of these seasons. Rainfall is high in the area with annual averages of between 2,200 mm-4,000 mm with net recharge assumed for the entire area put at 2,270 mm [27]. The low relative humidity is observed in the dry season mostly from January to March. The rainy period is known for elevated relative humidity levels of about 97% usually from April to October, and 95% relative humidity levels are observed within November and December [28]. The daytime temperature is in the range from 18°C to 34°C, with daily minimum and maximum average values of 19°C and 28°C, respectively [29]. An estimated evaporation and transpiration rate have been recorded to be 1,450 mm/yr and 1,460 mm/yr, respectively in the area [30].
The study area has low-lying to moderately high plain topography. The study area is characterized by a nearly flat topography. The elevation is generally between 14 m to 64 m above sea level. Figure 2B is the geological map of the study area. The study area is underlain entirely by the Benin Formation also known as the coastal plain sands [31]. Its age ranges from Miocene to recent. The Benin Formation is an extensive stratigraphic unit in the southern part of the Nigerian sedimentary basin. It extends from the west across the Niger Delta and southward beyond the present coastline. The sediments were deposited in a variety of environments from marine, through the deltaic, estuarine, and coastal swamp to lagoonal and fluvial [32]. The sands are mostly medium to coarse-grained, gravely, locally fine-grained, poorly sorted, subangular to well-rounded, and bears lignite streaks and wood fragments in some places [33,34]. It is over 90 percent of sandstone with minor shale intercalations. Stratigraphically, the Benin Formation is overlain by recent alluvium or recent sediments and underlain by the paralic Agbada Formation.
Alaoji Aba and Elekiahia Port Harcourt MVs have existed for more than thirty years. There are more than two hundred automobile workshops in each of these MV’s with about three hundred automobile mechanics and artisans in the business of repairs and sale of auto scrap parts. The activities in these MVs results in dumping or spilling of used engine oils, lubricating oils and other solvents containing PHs within and around the workshops (Figure 1B). The activities of mechanics in these areas could impact negatively on the ecology of these locations (Figure 1B). This problem is compounded by hips of metal scrap and body parts of abandoned vehicles (Figure 1A) within the MVs which could elevate the levels of concentration of heavy metals and other pollutants in the environment.
Sample collection and preparation
Samples were collected from Alaoji MV in Aba, Abia State and Elekahia MV, Port Harcourt, River State both in the Niger Delta region, Southern Nigeria (Figure 2B). Three soil samples from the top soils at 0–10 cm depth were collected in triplicate at each sampling point within the selected MVs. The soil samples were collected in June 2018. Soil samples from the same point were homogenized to form a representative sample. In all, a total of six soil samples were collected from the study area. The samples were labeled A1, A2, A3, E1, E2, and E3. A1 and A2 were soil samples collected from Alaoji Aba MV, E1 and E2 were collected from Elekahia Port Harcourt MV, while A3 and E3 stand for Alaoji Aba MV and Elekahia Port Harcourt MV control soil samples. The coordinates of the sample points were referenced with the Garmin, GPS map 76. The samples were taken with the aid of a soil auger at different activity centres within the selected MVs. The control soil samples were taken at distances of between 400 to 500 m away from the MVs. The soil samples meant for PAH and TPH determination were stored in a dry glass bottle free of grease or oil and labeled appropriately, while the samples for metallic content analysis were collected with polyethylene bags. The soil samples were then transported to the laboratory for analysis in an ice chest.
Determination of heavy metals in soil samples from the MVs
The soil samples were digested with a mixture of hydrochloric and nitric acid (3:1, v/v) at 120°C as reported in earlier publications [18,23,35]. Concentrations of heavy metals, Pb, Cd, and Cr in the soil samples from the MVs were determined with the AAnalyst 400 Perkin Elmer, Atomic absorption spectrometer (AAS). The appropriate calibration curves were prepared to quantify the heavy metal concentrations in the same acid medium with standard metal solutions [18,23].
Measurement of TPH
The TPH content of the soil samples was extracted according to the methods earlier described by some authors [36–38]. 10 g of the soil sample was carefully mixed with 150 mL dichloromethane which was used as the extraction solvent and extracted for 4 hours 30 minutes. This was done in the presence of 2.5 g of dried sodium sulfate and 300 μg/mL of 1-chloro-octadecane as a surrogate standard. 0.3 g of silica was introduced into the extraction mixture after the extraction to facilitate the adsorption of polar materials like animal fats and oil from vegetable materials. The extracts were later passed through a Whatman glass fiber filter for filtration. The materials not removed by silica gel such as oil and grease were considered PHs [39]. The separation and determination of TPH contained in the soil samples were carried out with Gas Chromatography equipped with Flame Ionization Detector (GC-FID) (Agilent 6890N). A concentrated 3 μL of the sample was introduced into the GC column with a micro-syringe previously rinsed with dichloromethane (blank) and the sample. The TPH was determined at a specific chromatogram in mg/kg [40,41].
Determination of PAH
The extraction and analysis of soil samples from the MVs for PAH characterization followed the method in Nor et al. [42]. In this method, about 500 mg of the soil samples were dissolved using a mixture of 25 mL n-hexane and acetone (7:3, v/v). A microwave extraction arrangement was used with its pressure carefully controlled for 45 minutes. After cooling, the extract was filtered with a Whatman glass fiber filter in a glass bottle, followed by a concentration of the extract to 1.5 mL using a rotatory evaporator. PAH was determined by the GC quadrupole Mass Spectrometer (GC-MSD) (Agilent 5975 MSD). The sample was separated into its components by chromatographic separation using a capillary column of an internal diameter of 30 m×0.25 mm and film thickness of 0.25 μm, HP-5MS and a helium carrier gas of high purity (99.5%), having a flow rate of 1 mL/min from a steel cylindrical pipe. The chromatographic separation conditions include an injector temperature of 250°C and an initial 70°C temperature of the chromatographic column which was held for 1 minute. The temperature increase by 30°C/min to 200°C, by 35°C/min to 250°C, and by 10°C/min to 300°C and this was maintained for 25 minutes. The PAH content of the soil samples was quantified from the resulting chromatogram as earlier reported [43,44].
Quality control
The integrity of the analytical results was ensured following the use of standard procedures through quality laboratory assurance. The analyses were conducted and the average taken from triplicate runs. Deionized water was double distilled using Eco-Still Mark, BSIC/ECO-4 (Bhanu Scientific Instruments Company, India) before it was used for soil digestion and subsequent metal content determination in soil samples. The reagents and chemicals used for the analysis were of high analytical grade standard and were all sourced from Finlab Nigeria Limited Owerri, Imo State, Nigeria. These chemicals were used without further purification. Crude oil analytical standard was sourced from Nigerian Agip Oil Company, Nigeria, while diesel and petrol standards were obtained from Total Nigeria Ltd. The PAH standard was also sourced from Finlab, Owerri, Nigeria. The glassware and containers were properly washed in detergent, rinsed with deionized water, and dried in an oven (DHG-9023A, B. Brans Scientific and Instrument Company, England). Accuracy and precision were maintained during the determinations with the instruments through the replication of sample analysis alongside the reference standards. The AAS has instrument detection limit (IDL) of 0.1 mg/kg, with minimum detection limit (MDL) of 0.0008 mg/kg, 0.0008 mg/kg, and 0.015 mg/kg respectively for Cd, Cr, and Pb. The IDL of GC-MSD is up to 24 fg with MDL of 0.04 μg/L, accuracy of 99.0% and precision of 8.0% RSD. GC-FID has MDL of 400 pg-propane/mL and IDL of 1 ng/L, detection module accuracy of less than ±3 mL/min NTP with repeatability of less than ±0.35% of sept point at a temperature coefficient of less than ±0.20 mL/min NTP for each rise in temperature (°C) and precision of 0.008% RSD.
Assessment of pollution indices
To ascertain the pollution levels of the study locations, the soil samples were assessed for the geo-accumulation index (Igeo) and the potential ecological risk index.
Geo-accumulation Index (Igeo)
Igeo values of the data obtained were used to quantify the extent of the heavy metal pollution of the soil samples. This was calculated according to equation (1) as described by a previous report [45].
where Cms is the concentration of the metal in the soil sample and Cb is the geochemical background concentration of the metal. The factor of 1.5, accounts for the probable variation in the background concentration of the metals due to lithogenic effect. The world average value in shale was taken as the background concentration in this study, which are 20 mg/kg for Pb, 90 mg/kg for Cr and 0.3 mg/kg for Cd [46]. The Igeo is usually classified into seven classes ranging from 0 to 6 as follows: Igeo<0 is practically uncontaminated; 0<Igeo<1 uncontaminated to moderately contaminated; 1<Igeo<2 moderately contaminated; 2<Igeo<3 moderately to heavily contaminated; 3 <Igeo<4 heavily contaminated; 4<Igeo<5 heavily to very heavily contaminated sample; Igeo≥5 is an indication of very heavily contaminated sample [44,47].
Potential ecological risk
Assessment of potential ecological risk is intended to determine the degree of heavy metal pollution in soils using the toxicity of heavy metals and their response factor in the environment as introduced by Hakanson [48]. The potential ecological risk due to the presence of toxic metals could be calculated using equations (2) to (4).
where Pi is the single metal pollution index; Cms is the concentration of heavy metal in the soil samples; Cb is the reference value for the metal. The target values stated by the Department of Petroleum Resources was chosen for Cb, which is 85 mg/kg for Pb, 100 mg/kg for Cr and 0.8 mg/kg for Cd [44].
E i r T i r E i r E i r < 40 40 ≤ E i r < 80 80 ≤ E i r < 160 160 ≤ E i r < 320 320 ≤ E i r
Results and Discussion
Levels of heavy metals and TPH
The result of soil geochemical analysis for the heavy metals (Pb, Cr, and Cd) and their allowed limits are presented in Table 1.
The results showed that Pb concentrations within the study sites were between 130 and 1,925 mg/kg. These values were much higher than the concentrations recorded at control sample points A3 and E3 with 40 mg/kg and 24 mg/kg respectively. The concentrations recorded for lead were higher than the permissible value of 50 mg/kg by USEPA, but within NESREA’s limit of 164 mg/kg for samples A2 and E2, while samples A1 and E1 were far above NESREA’s limit of 164 mg/kg.
The Cr concentration levels obtained in the study area were lower than 2 mg/kg which are higher than the values obtained for the control sample points. The recorded values were generally much lower than the allowed values of 50 and 100 mg/kg by USEPA and NESREA respectively. Cd concentration levels was less than 1 mg/kg to 8.5 mg/kg for the study area. The observed values were higher than the control values of less than 1mg/kg and also higher than the allowed value of 1 mg/kg by USEPA. The recorded values were also found to be higher than NESREA’s limit of 3 mg/kg except for sample A2 which was less than 2 mg/kg.
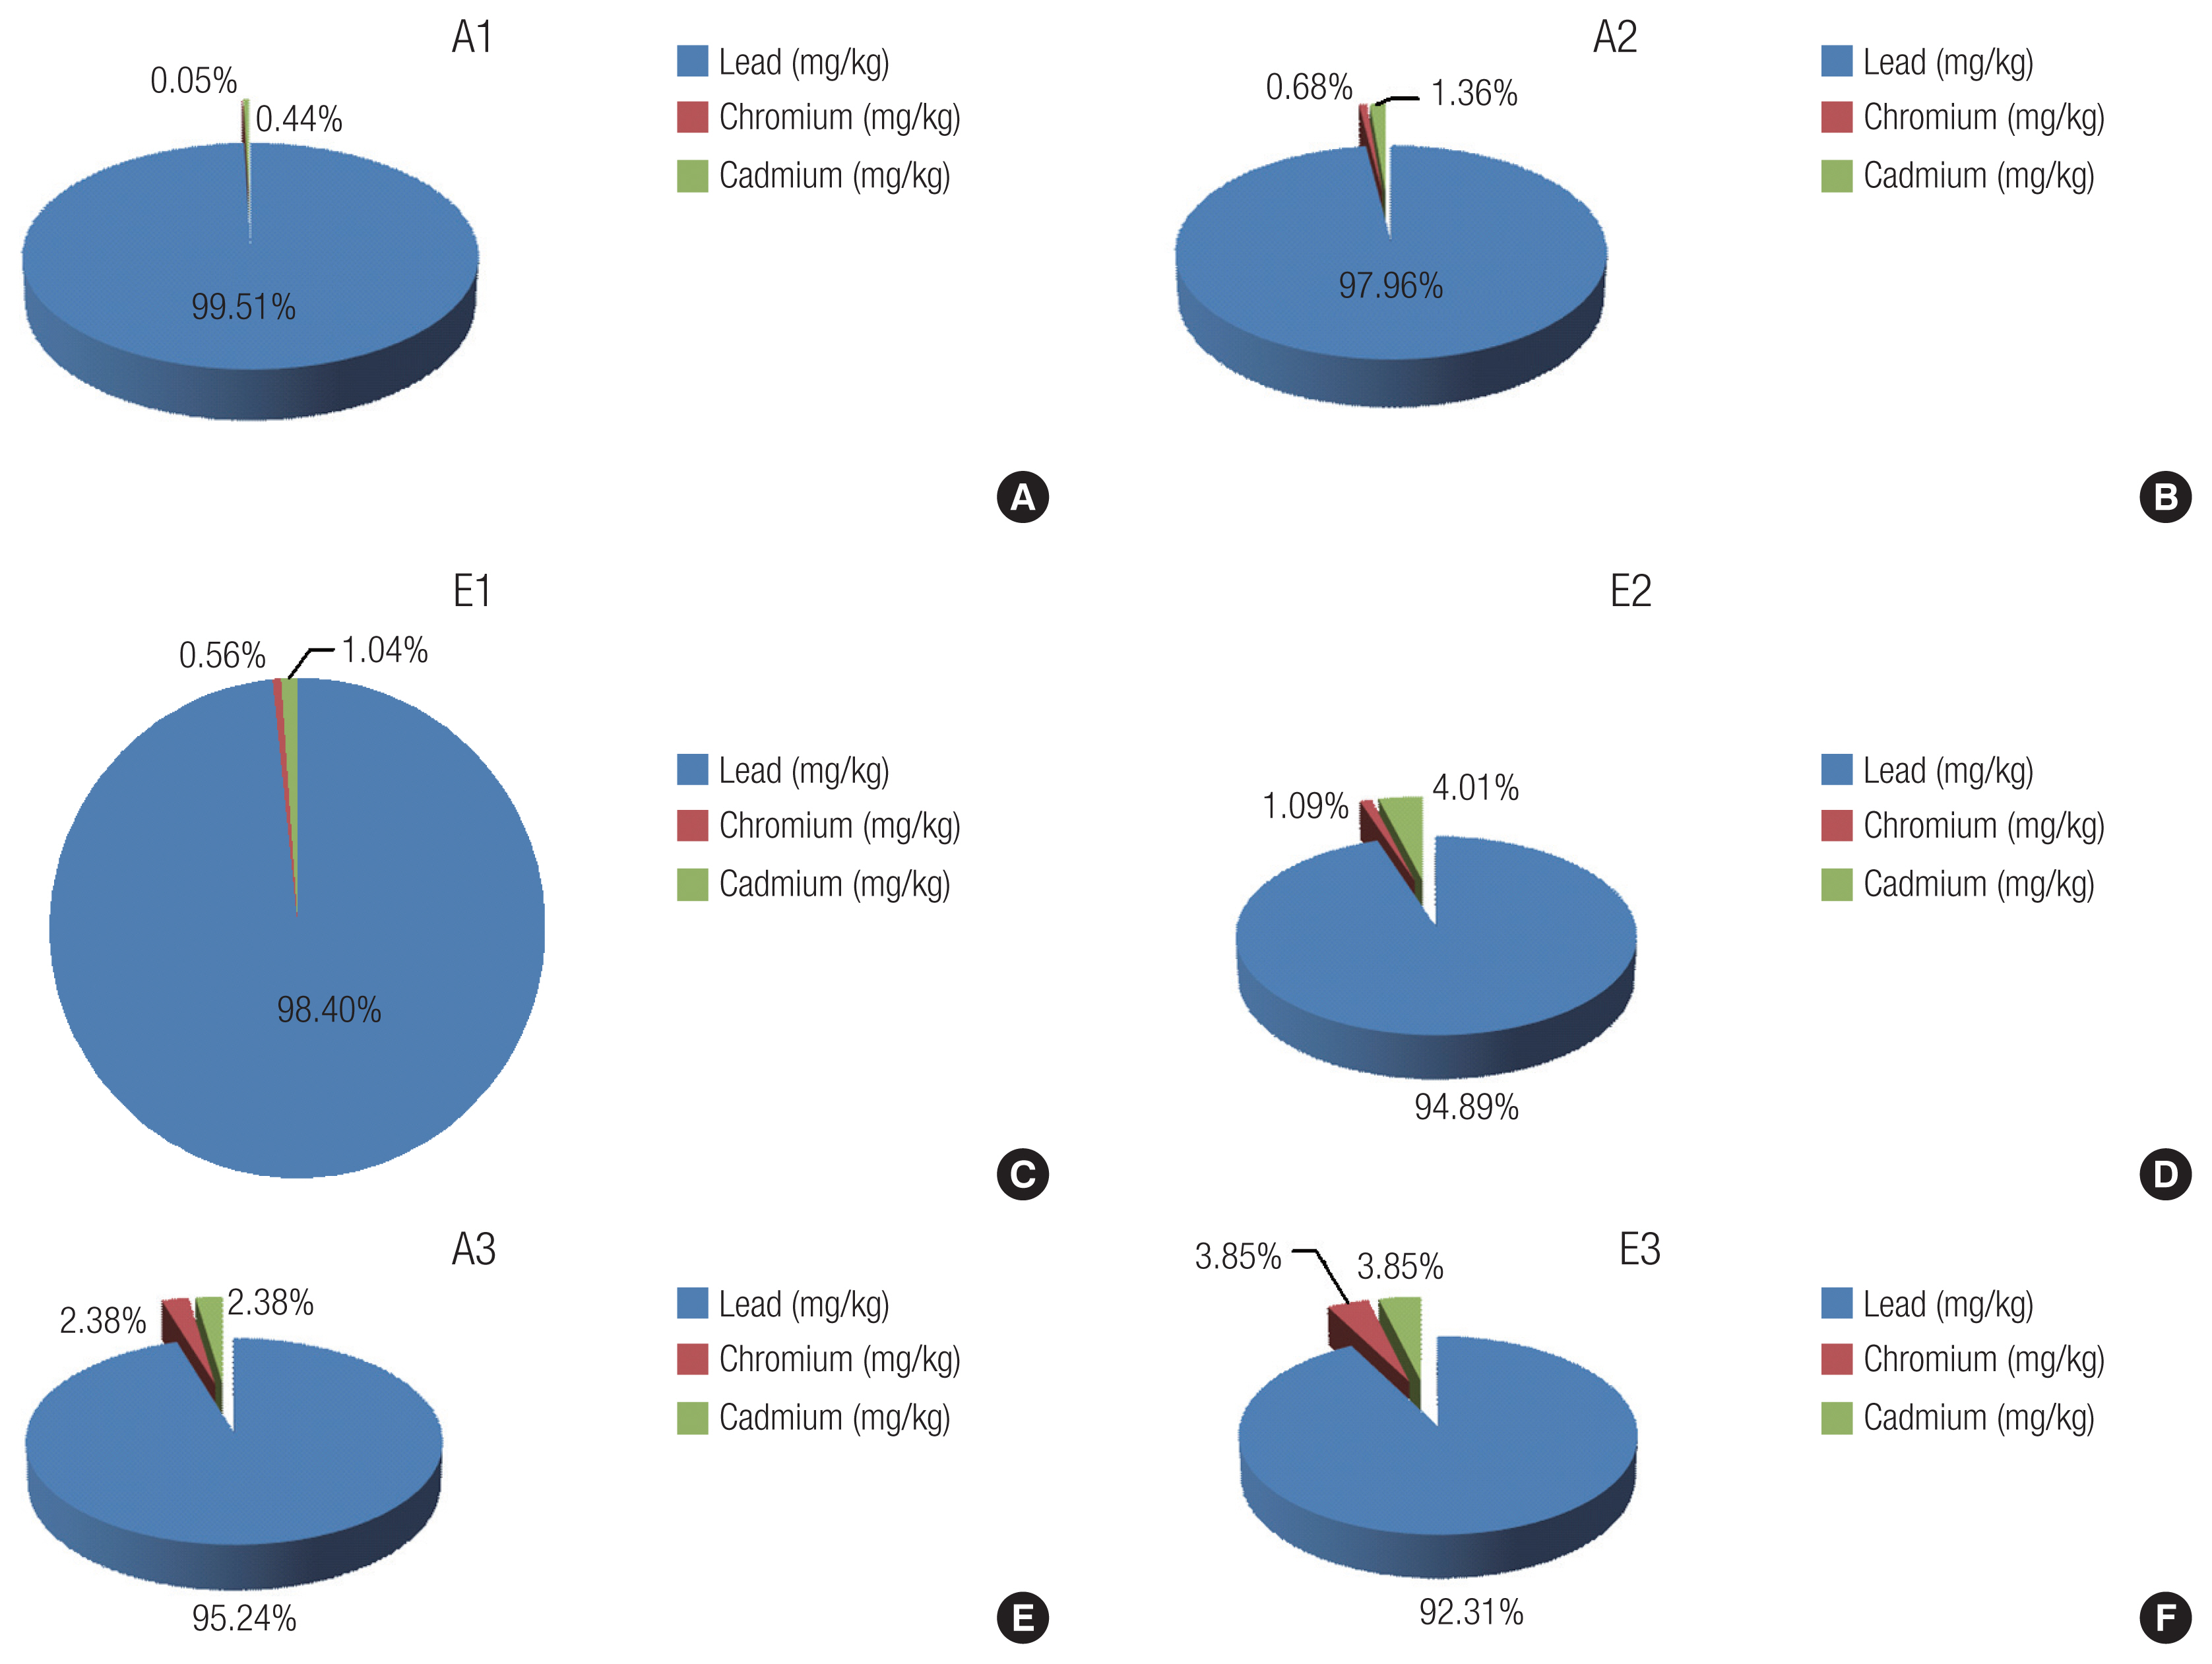
The percentage concentration of Pb, Cd, and Cr in the soil samples A1, A2, E1, and E2 are presented in Figures 3A–D. Similarly, the percentage concentrations of Pb, Cd, and Cr in the control samples A3 and E3 are shown in Figure 3E and 3F. Samples within the study area revealed elevated levels of lead followed by minimal Cd and very low Cr concentrations. The control sites showed lead presence but with very insignificant concentrations when compared with the study areas.
TPH concentration levels recorded in the soil samples examined within the vicinity of the MVs were between 970 mg/kg and 38,327 mg/kg as indicated in Table 1. The TPH concentrations were above 0.08 mg/kg and 1.7 mg/kg for the control sample points and higher than background values by the department of petroleum resources and New South Wales recommended maximum permissible limit of 1,000 mg/kg except for E1 which was 970 mg/kg [49,50]. The concentrations of TPH across the study area and control sample points as presented in Table 1 revealed very high concentrations of TPH in the soil samples A1, A2, E1, and E2 within the study area. The TPH concentrations of the control samples A3 and E3 were extremely low. A comparison of the results of TPH levels for A1, A2, E1, and E2 with A3 and E3 suggested that the observed levels of TPH at Alaoji Aba and Elekahia Port Harcourt MVs are mainly due to the activities of the automobile mechanics in the respective MVs. Elevated levels of TPH and heavy metals within and around automobile mechanics have been reported in important publications [9,19].
Concentration of PAHs
Table 2 is the result of the concentrations of the total PAH within the study area and the control samples. Table 2 revealed mean PAH levels of 0.09, 1.13, 0.02, 0.13, 0.46, and 0.03 mg/kg respectively for A1, A2, A3, E1, E2, and E3, suggesting elevated levels of PAH in the soil samples from the MVs (A1, A2, E1, and E2) compared to the PAH values recorded at the control sample points (A3 and E3). As shown in Table 2, a total of seventeen PAHs were recorded in the analyzed soil samples. Higher concentrations of PAHs were observed in sample A2 compared to other samples. Elevated levels of pyrene (3.09 mg/kg), fluorene (1.78 mg/kg), and fluoranthene (1.59) were recorded in sample A2, pyrene (2.60 mg/kg) and 1.80 mg/kg of phenanthrene were the highest concentration of PAH recorded in sample E2 as A1, A3, E1, and E3 recorded values less than unity. The observed elevated levels of PAH’s at A2 may not be unconnected with the prolonged activities at the Alaoji Aba MV, which has existed for over thirty years.
The recorded PAHs values within the study area are higher than the recommended levels of 1,000 μg/kg, 1,500 μg/kg, and 5 mg/kg recommended by soil clean-up guidelines from Denmark, the Netherlands and Australia respectively [47–53]. The high PAHs content of the soil samples within the study area is an indication of contamination of the study sites. Samples taken from the control sites that were a distance away from the study sites were lower than the recommended levels of 1,000 μg/kg, and 1,500 μg/kg recommended by soil clean-up guidelines from the Netherlands and Australia respectively [47–53].
The high-level of Pb observed in the soil from the study area could be from the indiscriminate disposal of waste from lead-acid batteries, lead-based solder; metallic alloy, lead-based paints, used oil, waste incineration, scrap and junk part of automobile [54]. These parts may be coated with oil or grease, which may contain lead residues that may in the long run harmfully affect storm water runoff that may further endanger aquatic life and public drinking water supplies. Also, leachates from these wastes via storm water run-off could infiltrate in the groundwater system. Aquifers are known to be vulnerable to various contaminants and sediment loads including microscopic bacteria, viruses, and protozoa [55]. Seepage and infiltrations of pollutants from surface water could also affect the quality of groundwater. Pb has no known biological benefit to humans as it can damage various systems of the body including the nervous system, reproductive system, and the kidney, and can further cause high blood pressure and anaemia [56]. The minimal Pb levels in control samples might be of natural origin since there is no known industrial activity at the control site. Cd was also found to be relatively high except for sample point A2 which was less than 2 mg/kg. The high Cd concentrations in the study area may be a result of the disposal of waste containing Cd such as waste batteries and paints.
Alinnor and Nwachukwu reported that soil samples in parts of Rivers State, Nigeria were contaminated with TPH concentrations of 1,534.7 mg/kg, 1,438.0 mg/kg, and 1,651.0 mg/kg at depths of 0.0 to 0.5 m, 0.5 to 1.0 m and 1.0 to 2.0 m, respectively [41]. The above values are higher than values obtained in this study, except A2 which is 38,327 mg/kg [41]. According to Iturbe et al. [45], the soils of Coastal Mexican Refinery were heavily contaminated with hydrocarbons with detectable TPH concentration in the region of 130,000 mg/kg. This value was higher than those recorded in this work. Ogoko reported PAHs and TPH values which ranged from 6.30 to 7.40 mg/kg and 5,120.50 to 24,902.23 mg/kg respectively at NNPC Depot Aba, which was above values reported in the present study [39]. The observed elevated concentrations of TPH and PAH in the study area may be attributed to indiscriminate disposal and handling of used/spent petroleum products [39].
The high PAH is an indication of soil contamination by PAH within the study area. The source of the PAH may be products of incomplete combustion of fossil fuel while other important sources may include automobile and truck emissions. The observed differences in the concentration of the pollutants in the two MVs may be attributed to the number of years the mechanic workshops may have been in operation, the volume of work done at each site, types of automobiles serviced or repaired, types of lubricant commonly used, mode of wastes disposal and type of soil [9].
The diagnostic ratio of the PAHs
Diagnostic ratios have been used as a method of identification of PAH sources, which is important in distinguishing between natural and anthropogenically generated PAHs in the environment [57]. Though some uncertainties are associated with the use of diagnostic ratios [58], however, the method has been adopted in the determination of PAH point sources by many researchers to locate contamination of the environment by PAH. The result of the diagnostic ratio of the PAHs is presented in Table 3. The observed ratio of phenanthrene to anthracene is suggestive of pyrogenic origin [59]. It was observed that An/Phe+An values were all less than one, which implies that the PAHs are of petrogenic origin. The values of the ratio Fla/Pyr were all less than one except in sample E1, suggesting that the PAHs in sample A1, A2, A3, E2, and E3 are of petrogenic origin while that of E1 is of pyrogenic origin [57]. Also, the values recorded for Fla/Pyr+Fla in all the sample sites were less than 0.5 except in sample E1, which indicates that the PAHs are due to emissions from petroleum products, while that of sample E1 is due to diesel emissions [57]. This is possibly due to the activities of automobile mechanics in the MVs under investigation. The ratio of Ba/Ba+Chy in the study locations was 0.24 and 0.30 at E1 and A1 respectively, indicating the presence of these PAHs in the study area due to the combustion of carbonaceous materials. The other samples revealed values which are more than 0.35, indicating PAHs due to the presence of vehicular emissions as well as combustion. The values recorded for the ratio; Ind/Ind+B(ghi)p as shown in Table 3 is an indication that the PAHs are likely due to the combustion of petroleum products as well as biomass [57]. The values recorded for the ratio of low molecular weight to high molecular weight (LMW/HMW) more than 1is suggestive of petrogenic sources, while the ratio less than 1 indicates pyrogenic sources of the PAHs. Finally, the values for Mepl/Phe as shown in Table 3 no doubt revealed the presence of PAHs due to the combustion of fossil fuel [60], indicating anthropogenic activities in the MVs under investigation.
Indices of pollution
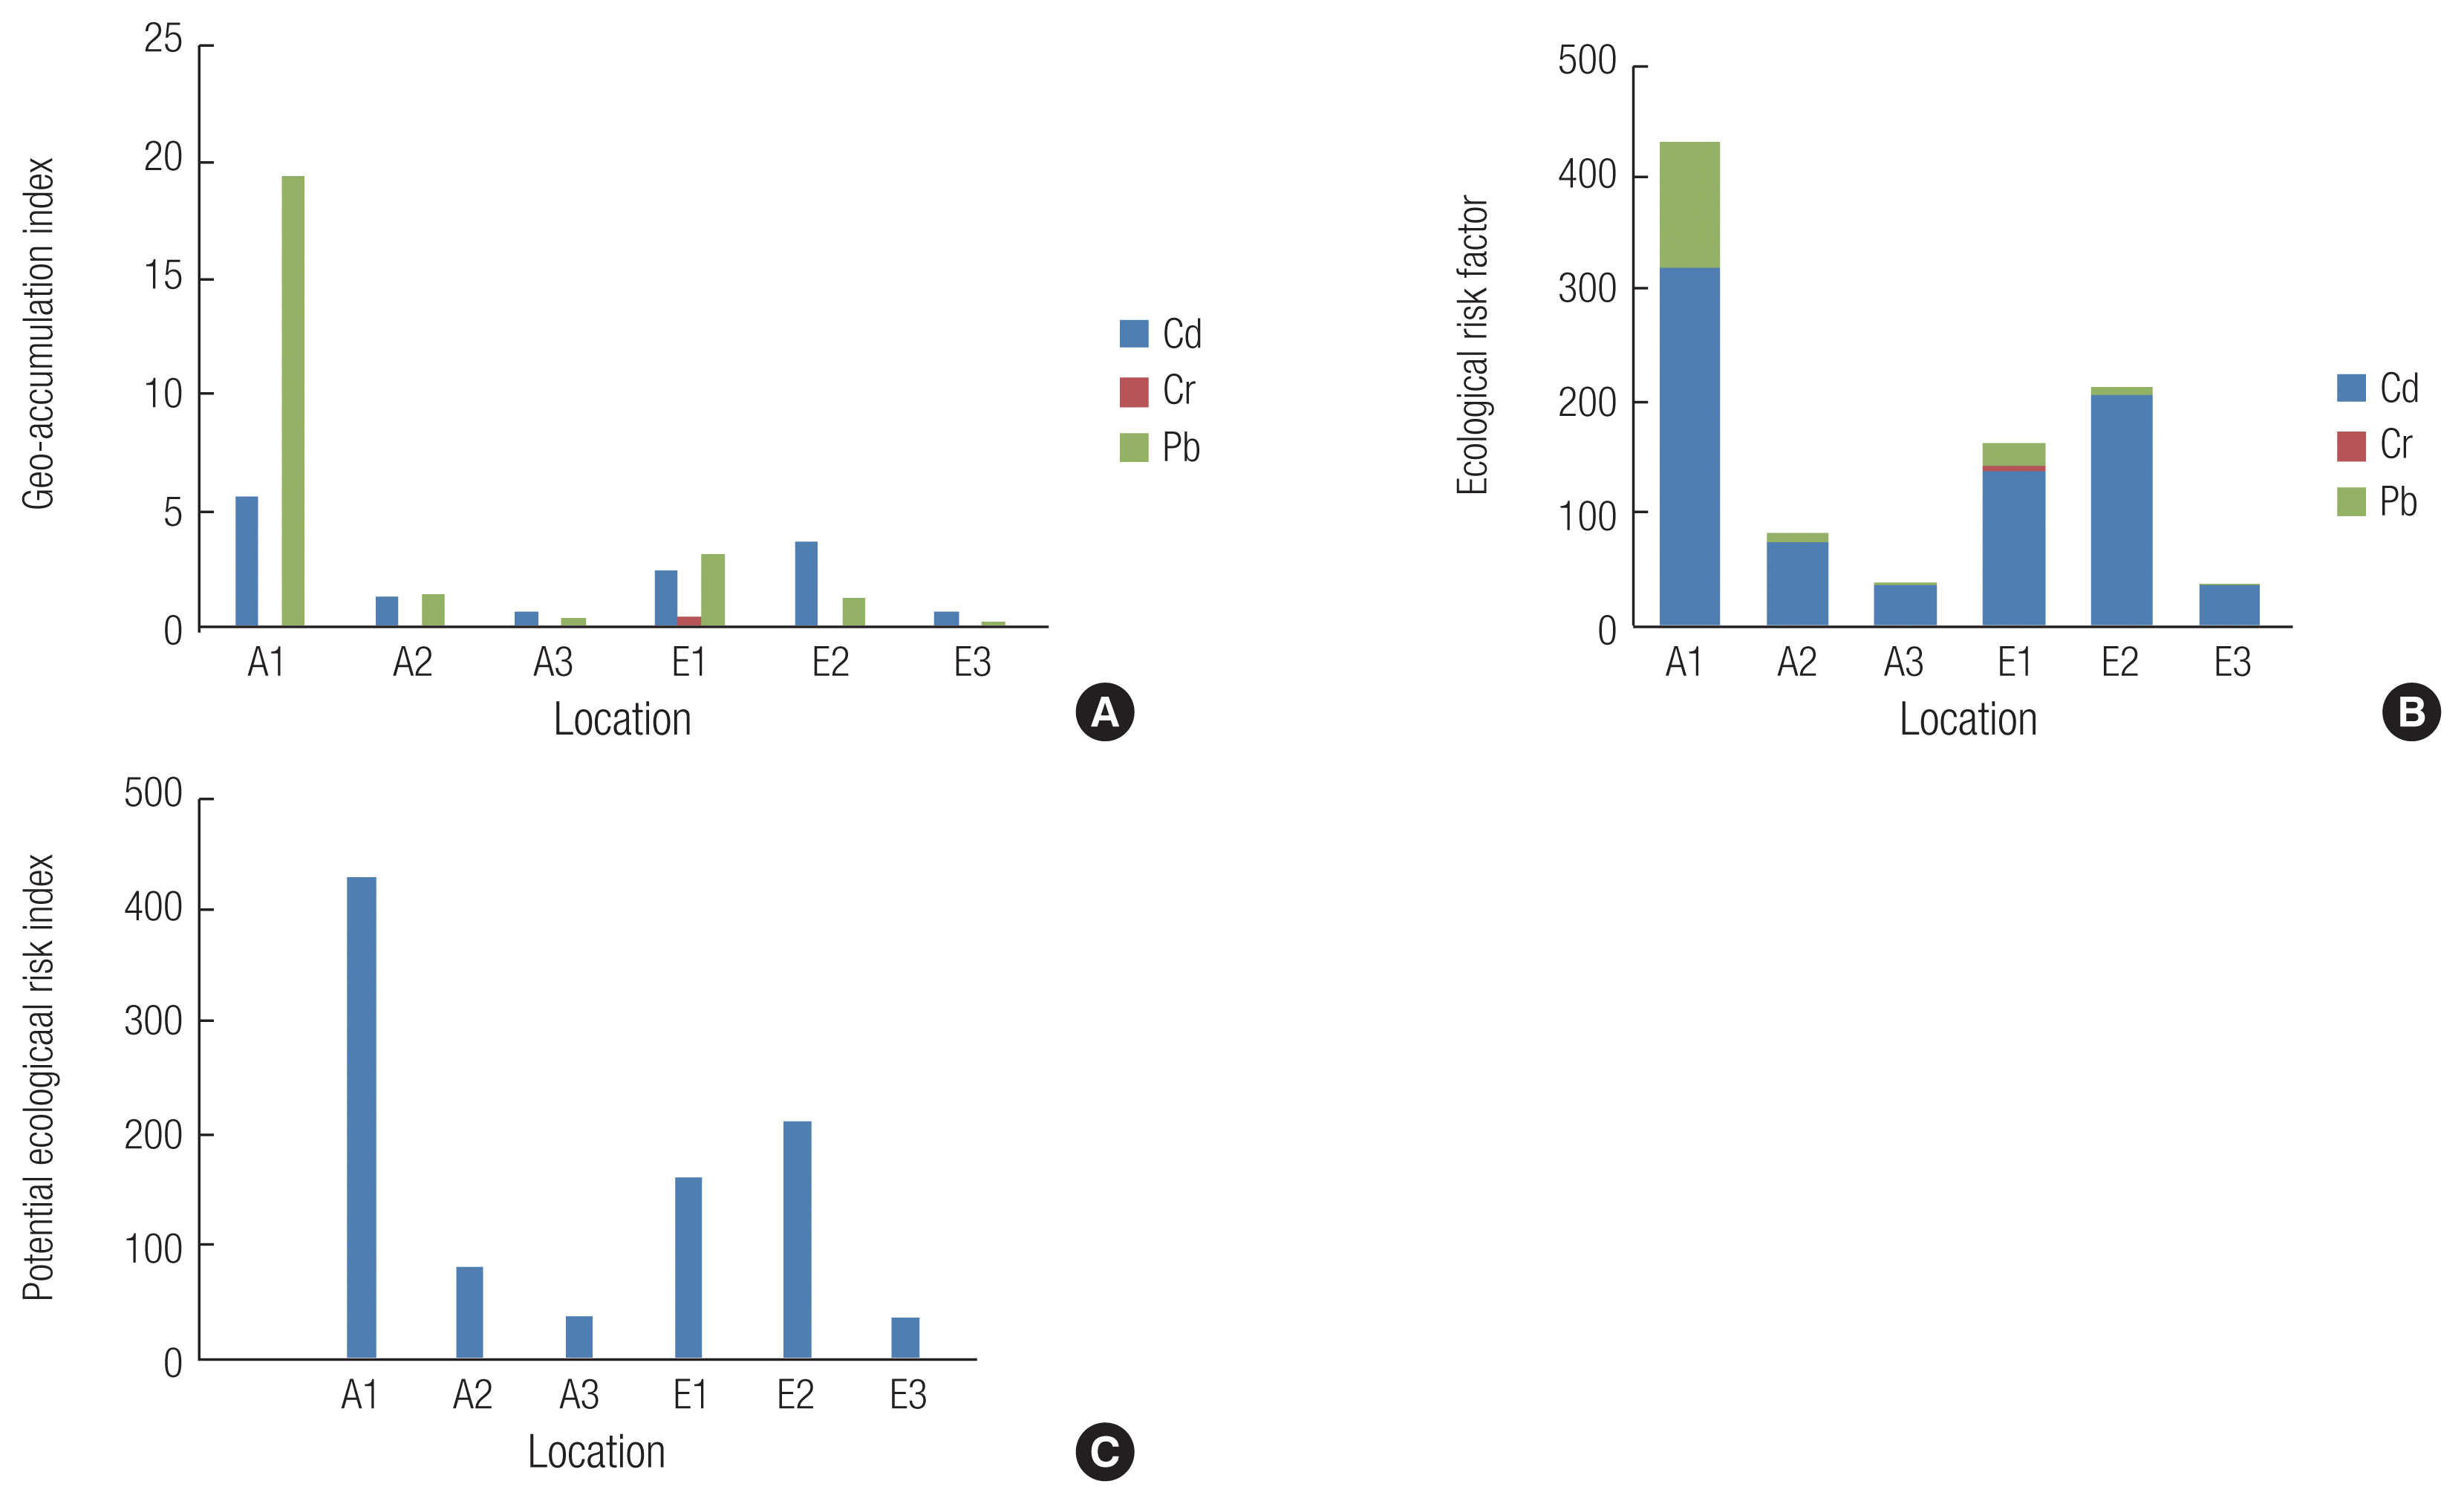
The detailed result of Igeo analysis of the heavy metals at different locations is presented in Figure 4A. The results indicate that the Igeo of the heavy metals is in the order Pb>Cd>Cr. The Igeo data except for Cr at A1, A2, A3, E2, and E3 suggests that the contamination level is alarming and calls for urgent environmental attention. The Igeo values for Cd and Pb are very far above unity except at A3 and E3, which indicates moderately contaminated to very heavily contaminated samples. It was observed that Cd and Pb at A1 showed significant Igeo values which imply that Alaoji Aba MV is very heavily contaminated with Cd and Pb. The contamination levels of Cd and Pb are an indication of anthropogenic influence due to the activities of automobile mechanics in the studied MVs [9].
The result of the ecological risk factor and potential ecological risk of the heavy metals are presented in Figures 4B and 4C. The monomial risk factor of the heavy metals in the soil samples from the MVs is in the order of Cd>Pb>Cr as shown in Figure 4B. This is an indication that Cd posed moderate to high risk, while Pb posed a considerable risk. The results suggest that the presence of these heavy metals posed moderate to high risk not only to the region but to the ecosystem. The monomial ecological risks factor of Cr at all the sample sites including the control were all below 40, showing that the observed concentrations of the metals posed no risk to the environment.
The RI was determined in an attempt to quantify the total potential ecological risk associated with the heavy metals in the soil samples from the MVs as indicated in Figure 4C. A1, E2, and E1 respectively represent a very high risk, considerable risk and moderate risk to the area under study as well as the surrounding environment. Low risk to the environment was observed in the cases of A2, A3, and E3. The RI describes the impact of heavy metals on the local ecosystem and signifies the ecological risk due to overall pollution.
The high values of Igeo, Eir, and RI of the heavy metals in most of the study locations could be attributed to the activities of the automobile mechanics in the MVs. Activities such as indiscriminate disposal of spent engine oil, discarded vehicle spare parts as well as other maintenance activities could increase the overall heavy metal contamination burden of the environment.
Conclusion and recommendations
The geochemical investigation of the study revealed that anthropogenic factors such as indiscriminate disposal and poor management of waste generated by artisans in the MVs are responsible for the observed level of soil pollution. The concentrations of heavy metals, TPH and PAH determined in the soil samples obtained from the two MVs in this study are evidently above the permissible levels for most of the parameters examined. Diagnostic ratio analysis suggests that the PAHs are majorly due to petroleum products from the automobiles serviced in the MVs. It was observed that Alaoji Aba MV recorded higher concentrations of all the measured parameters, which is associated with the level of anthropogenic activities in this MV. Alaoji Aba MV doubles as a regional automobile spare parts/scrap metals market as well as a major MV coupled with the long duration of activities of the artisans in the area. The geological formation (Benin Formation) of the area could have also influenced the observed levels of the analyzed parameters as well as the prolonged rainy periods which may retard the evaporation of spilled used engine oil.
Risk assessment analysis showed that Cd and Pb at A1 have significant Igeo values which imply that Alaoji Aba MV is very heavily contaminated with Cd and Pb. The overall RI result revealed that the presence of these heavy metals poses moderate to high risk not only to the region but to the entire ecosystem. The observed level of contamination could be associated with the porosity, high permeability, and transitivity of the Benin Formation. There could be a heavy metal build-up in these MVs, which may be risky over time as it may lead to pollution of groundwater systems and nearby farmlands if no monitoring programme is put in place to check the activities of the auto-mechanics in this area.
The environmental and public health hazards associated with the indiscriminate siting of MVs without prescribed standards by the authorities outweigh the current benefit derived from this practice. There is, therefore, a need to decongest or relocate the MVs to a more geologically appropriate location with formations characterized by very low permeability.