


INTRODUCTION
Perchlorate, which is a stable, hydrophilic, anionic, chlorine-oxidized substance, has recently been categorized as a hazardous substance. Perchlorate has been reported to develop naturally from caliche deposits in the Atacama Desert in Chile, but it is usually artificially produced in forms of such as ammonium perchlorate, potassium perchlorate, or sodium perchlorate [1,2]. Perchlorate is added to fireworks powder as an oxidizing agent to produce diverse colors or roaring sounds, and used as an oxygen carrier in rocket propellant. In addition, perchlorate is also used as an ingredient in paints, brighteners, laundry bleach, and the detergent in liquid crystal displays (LCD) manufacturing [3].
It is known that perchlorate intervenes of thyroid gland that absorbs iodine by competing with iodine ion inside human body, causing problems in growth and development of infants and toddlers because it participates in regulation of a thyroid gland metabolism function. For adults, in case of consistent ingestion of perchlorate, perchlorate can induce an obstacle in bone marrow [4]. Current studies of the perchlorate effects on the carcinogenesis of thyroid gland in animals are available [1,2,4], but there is a lack of information describing the relationship between thyroid gland cancer and perchlorate levels in humans.
Humans are directly exposed to perchlorate through inhalation of the perchlorate in the atmosphere or contact with polluted media such as perchlorate contaminated soil or surface water. Humans can also be indirectly exposed to perchlorate through ingestion of crops or drinking water produced in an environment that has been polluted by perchlorate [5,6]. Indeed, recent studies have shown that food ingestion accounts for 83% of the total exposure to perchlorate, indicating that food intake is the main exposure route [7].
As a result, the United States Environmental Protection Agency (USEPA) added perchlorate to the Contaminant Candidate List in 1998, and the National Academy of Sciences (NAS) established perchlorate reference dose (RfD) of 0.7 µg/kg-day in 2005. Based on the NAS regulations, the USEPA established a limit of 24.5 µg/L perchlorate in drinking water. In the United States, many states are strictly managing the concentration of perchlorate in drinking water. For example, Massachusetts and California have set maximum concentration limits of 2 µg/L and 6 µg/L, respectively [8].
In Korea, perchlorate was found in the effluent of Gumi Industrial Complex in Kyungbuk and even detected in tap water with levels exceeding the standards set by the USEPA, which gained widespread attention [9] and resulted in a perchlorate guideline of 6 ppb being set for Nakdong River at Wae-kwan Bridge during dry season. The Ministry of Korean Environment also set the perchlorate guideline at 0.2 ppm for clean areas and 0.02 ppm for other areas in October 2008. Recently, perchlorate was also designated as a drinking water quality monitoring chemical in 2009 [10]. Despite these reinforced policies, there is a still possibility for secondary pollution through agricultural and livestock farming owing to the use of perchlorate-contaminated water [10]. Therefore, management of perchlorate in media other than drinking water, especially food, is necessary.
Many countries investigated the concentrations of perchlorate in food but mostly focused on dairy products [11-16]. The United States Food and Drug Administration (FDA) monitored perchlorate in 775 food samples from October 2003 to September 2004 and found high perchlorate levels in 27 types of foods from all 50 states [14]. Additionally, recent studies in Korea also reported the presence of perchlorate in milk sold at a market. However, this study analyzed perchlorate in white milk only with small number of samples; therefore, further investigation is needed [15,17].
The main intake group of milk comprises infants and children, who are particularly vulnerable to hazardous substances; therefore, the perchlorate analysis of dairy food samples is important. According to the Third Korean National Health and Nutrition Examination Survey (KNHANES III) - Nutrition Survey (II) conducted by the Korea Ministry of Health and Welfare, the intake of domestic dairy products is steadily increasing. The intake of dairy products by children aged 1 to 12 is 613.7 g/day, and this age group accounts for 68% of the total intake. However, very few studies of perchlorate in food have been conducted, and the perchlorate analysis method in food samples has not been fully developed in Korea [18]. Moreover, in dairy products, various substances such as fats, proteins, carbohydrates, or inorganic matter interfere with analysis. Therefore, development of analytical methods that remove these substances efficiently is essential.
Accordingly, this study was conducted to develop pretreatment methods for the analysis of perchlorate in dairy products and evaluate the level of perchlorate in dairy products sold in domestic markets. In addition, the daily exposure of Korean to perchlorate by the consumption of dairy products was estimated using the results of perchlorate monitoring in this study.
MATERIALS AND METHODS
I. Reagents
Perchlorate standard solution was purchased from AccuStandard (New Haven, CT, USA), and 18O4-labeled perchlorate used as an internal standard was purchased from Cambridge Isotope Laboratories, Inc. (Andover, MA, USA). Acetonitrile and HPLC grade water were obtained from J.T.Baker (Phillipsburg, NJ, USA), and acetic acid was purchased from Waco Pure Chemical Industries, Ltd. (Japan). The 40% methylamine solution used as the LC-MS/MS mobile phase was purchased from Yakuri Pure Chemicals Co., Ltd. (Japan).
II. Extraction of Samples
We selected 10 brands of white milk, 3 kinds of low-fat milk, and 10 varieties of processed milk that have high sales volume, as well as 9 spooned yogurt products and 11 liquefied yogurt products as samples. The samples were purchased on May 29, 2010 in supermarkets. Upon arrival in the laboratory, the samples were refrigerated at 4℃ and their pretreatment and analysis were completed within five days of being purchased.
III. Assessment of Pretreatment Methods
Perchlorate in samples was typically extracted using water. Acetonitrile is used to decrease the turbidity of samples and solidify the fat and protein, and acetic acid is used to prevent perchlorate retaining in SPE (EM™ Carb SPE cartridge) cartridge [19]. Recently, the U.S FDA published the perchlorate analysis method extracting with centrifugation and SPE using acetic acid and acetonitrile together [20].
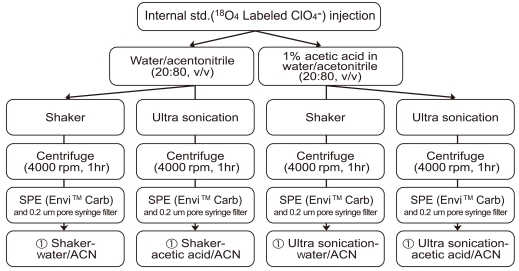
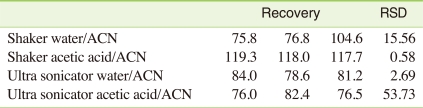
We tested extraction efficiency with shaker and sonicator (JAC Ultrasonic 2010, GODO, Korea) using distilled water/acetonitrile and 1% acetic acid/acetonitrile as the extracting solvents and compared the results (Figure 1). Briefly, 5 mL aliquots of sample were pipetted into 50 mL polypropylene conical tubes, after spiking internal standard (100 mg/mL)and the samples were lightly shaken by hands. Next, 20 mL of acetonitrile were added with 5 mL of 1% acetic acid or 5 mL of distilled water.
After adding these solvents, the sample was extracted with either shaker (200 rpm, 1 hour) or sonicator (JAC Ultrasonic 2010, GODO, Korea, 1 hour). After the extraction was completed, the samples were centrifuged at 4000 rpm for 1 hour, and the supernatant was then cleaned using a Supelclean™ Envi™ Carb SPE cartridge (Bellefonte, PA, USA)with controlling eluent velocity of 2 drops/second. After all of the supernatant passed through the cartridge, the inside wall of the cartridge was washed with 6 mL of distilled water, giving a final volume of 40 mL. The sample was then passed through a 0.2 µm pore PTFE syringe filter, and analyzed by LC-MS/MS.
IV. Instrumental Analysis
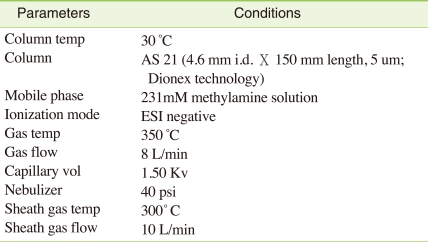
The Agilent 1200 HPLC system interfaced to 6460 triple-quadruple mass spectrometer (Agilent, USA) was used for LC/MS/MS analysis. An AS21 column (2 mm i.d × 250 mm, Dionex Technology) coupled to an AG21 guard column (2 mm i.d × 50 mm, Dionex Technology) was employed for the LC separation. The mobile phase was 235 mM of methylamine and MS/MS analysis was performed in negative electrospray ionization (ESI) mode. In the MRM (multiple reaction monitoring) mode, m/z 107 → 89 (quantification) and m/z 109 → 91 (confirmation) were monitored for 18O4-Labeled ClO4- and m/z 99 → 83 (quantification) and m/z 101 → 82 (confirmation) were used for ClO4-. Calibration curve was prepared with 10 different levels of perchlorate standard solutions with the range of 0.1 to 100 ppb and over 0.99 correlation factors were obtained (Table 1).
The recovery was obtained to check performance of the method. Three samples spiked known amounts of perchlorate and one sample that didn't add perchlorate standard were prepared and treated like sample and the recovery was calculated by the equation (matrix spike sample result - sample result)/spike added×100.
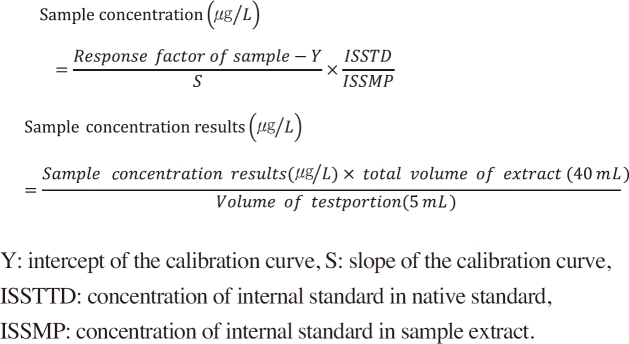
The dairy products were treated using the optimal analysis method selected from the recovery test, and the concentration of perchlorate in the dairy products was calculated using the following equation.
RESULTS
I. Evaluation of Analytical Method
Most previous studies were used centrifugation for removing solid content and the SPE catridges were used for extracting perchlorate. In a study conducted by Kirk et al. [11], all of the solidified protein was removed by adding a large amount of ethanol, after which they extracted perchlorate using an alumina column and C-18 SPE cartridge. Dyke et al. [12] analyzed the supernatant after removing the solid content by centrifugation at 16,000 rpm. Recently, the US FDA used 1% acetic acid/ acetonitrile in conjunction with a vortex mixer and subsequent centrifugation to remove the solid content, after which the perchlorate was extracted using a Supelclean™ Envi™ Carb SPE cartridge.
Therefore, in this study, the extraction efficiency of the technique based on US FDA was tested using different extraction solvent and methods. Specifically, distilled water/acetonitrile and 1% acetic acid/acetonitrile were used as the extractants. In addition, the extraction was conducted using a shaker or an ultrasonic wave extractor. The recoveries obtained from each method are listed in Table 2.
The recoveries obtained using the ultrasonic wave extractor ranged from 76.0% to 84.0% (mean: 79.8%), whereas 75.8%-119.3% (mean: 102.0%) for using the shaker. The recovery used distilled water/acetonitrile as extractant was 81.3%-85.7% (mean: 83.5%), whereas it was 78.3%-118.3% (mean: 98.3%) when 1% acetic acid/acetonitrile was used. A satisfactory recovery rate of more than 75% was achieved in all tested methods, indicating all these methods were suitable for dairy product samples. However, the method using shaker with 1% acetic acid/acetonitrile was shown the highest recovery (118.3 ± 0.58%) with small standard deviation; thus this technique was selected for dairy product monitoring in this study. Compared to the recovery obtained by Kirk et al. (>95%) [11] and Dyke et al. (100.9 ± 2.7%) [12], the recovery of established method in this study (shaker + 1% acetic acid/acetonitrile) was satisfactory.
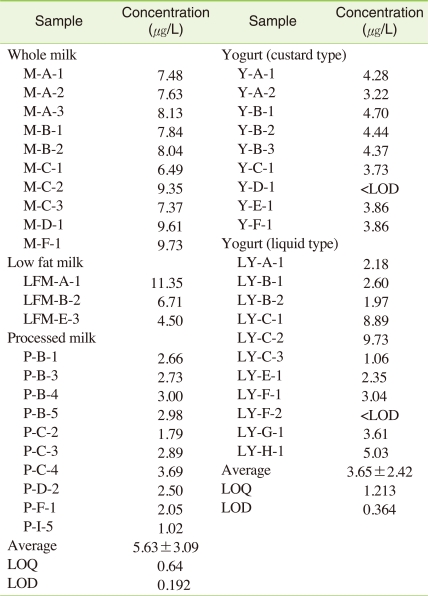
The limit of detection (LOD) was calculated for the signal-to-noise ratio (S/N ratio) of 3. Whereas the limit of quantification (LOQ) was calculated for the S/N ratio of 10. The LOD values calculated for milk and yogurt were 0.192 µg/L and 0.364 µg/L, respectively, whereas the LOQ values were 0.64 µg/L and 1.213 µg/L, respectively. These values are better than the LOQ (3.00 µg/L) and LOD (1.00 µg/L) reported by the US FDA.
II. Domestic Dairy Product Concentration
Based on statistical data obtained from the Korean Dairy Committee in 2009, the market share of the top three dairy producers was as follows: Seoul Milk Co., 37%; Maeil Dairies Co. and Namyang Dairy Products Co., 15%. In addition, there are approximately 20 other dairy companies in Korea. The Korean Dairy Committee has reported that the consumption rate for white milk and processed milk were 47% and 53%, respectively, in 2009, whereas those for liquid fermented milk and solid fermented milk were 35% and 65%, respectively. In addition, according to the top seven dairy production companies, there are approximately 120 brands of milk products and 65 brands of fermented milk products sold in domestic markets in Korea [21].
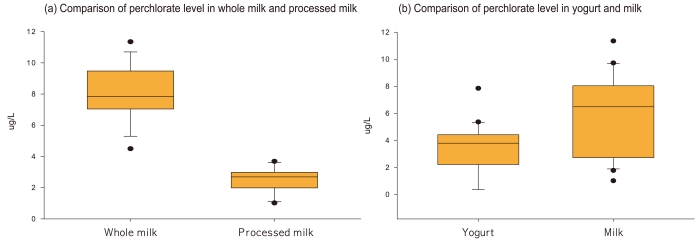
The 23 different brand milk products from top seven dairy companies and 20 different brand yogurt products from top eight dairy companies were selected and analyzed for this study based on the sales amounts in the market, which was considered to comprise 70% of the dairy products consumed in Korea. The recovery of dairy samples in this monitoring study was 85.4%-94.7%, which was satisfactory. The concentration of perchlorate in the total dairy products (whole milk, low fat milk, processed milk, curd-type yogurt, and liquid-type yogurt) was <LOD-11.35 µg/L, except for one white milk product that had a level of perchlorate below the LOQ. The average concentration of milk was 5.63 ± 3.09 µg/L, while that of yogurt (fermented milk) was 3.65 ± 2.42 µg/L. The average concentration of milk was slightly higher than that of fermented milk. Specifically, the average concentration of perchlorate was 6.49-9.73 µg/L in white milk, 4.5-11.35 µg/L in low fat milk, and 1.02-3.69 µg/L in processed milk. When the average concentrations of the total dairy products investigated in this study were compared, the concentration of perchlorate in white milk was higher than that in processed milk. In the case of fermented milk, the average concentration detected from solid fermented milk was <LOD-4.7 µg/L, whereas that of liquid fermented milk was <LOD-9.73 µg/L (Figure 2, Table 3).
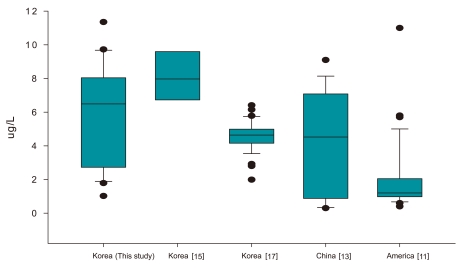
Figure 3 shows the levels of perchlorate observed in the present study, as well as the results obtained in 2008 and 2010 in domestic studies and those conducted in other countries. The results of the present study were similar to those of previous studies but the range of perchlorate (1.02-11.35 µg/L) in this study was wider than that in a previous domestic study by Kim et al. [15] (6.15-11.3 µg/L). This discrepancy can expect due to the different target samples that only white milk samples were analyzed in the previous studies. Whereas various milk products were analyzed in this study. Moreover, in a study conducted by Her et al. [17], experiments were performed using 37 types of white milk produced by 12 companies from eight different regions, as well as 26 kinds of powdered milk produced by four companies from three different regions. They were reported that the concentration of perchlorate in white milk ranged from 1.99-6.41 µg/L, which was lower than the concentration observed in the present study as well as the levels found in a study conducted by Kim et al. [15]
And the results of the present study were also compared to other countries. Studies conducted overseas. Analysis of 104 milk products sold in 14 different states by the US FDA revealed an average perchlorate concentration of 5.76 µg/L (1.5-11.3 µg/L) [11]. Additionally, a study conducted by Texas Tech. University revealed an average perchlorate concentration of 9.4 µg/L (6.7-12.1 µg/L) in milk products collected in 48 different regions within Japan [12]. Furthermore, analysis of 17 milk samples sold in Beijing, China, revealed an average perchlorate level of 4.1 µg/L (0.3-9.1 µg/L) [13]. Overall, the results of these studies were similar to those obtained for Korean milk products, although Korean products had a wider concentration range.
Shi et al. [13] reported that the detection of perchlorate in dairy products in China was originated from contaminated feed and drinking water provided to cattle. Dyke et al. [12] found higher perchlorate levels in Japan than in the United States as a result of contaminated feed imported from the United States. They further reported that this contamination was likely related with the higher number of airports per area in the United States, as well as the higher concentrations of perchlorate emitted to the atmosphere and perchlorate polluted grass [12]. Her et al. [17]. also suggested the possibility of perchlorate contamination in Korean milk from perchlorate polluted feed imported from other countries.
All these results indicate that exposure to perchlorate can occur in Korea through perchlorate polluted water and feed stuff in farms during the production process of dairy products. Accordingly, further research should be also conducted to investigate perchlorate contamination in water and feed as well as perchlorate pollution during milk distribution and processing.
III. Assessment of Exposure to Perchlorate via Consumption of Dairy Products
In this study, human exposure to perchlorate in dairy products was estimated based on the levels observed in dairy products. Specifically, the amount of perchlorate that humans are exposed was calculated using the following equation.
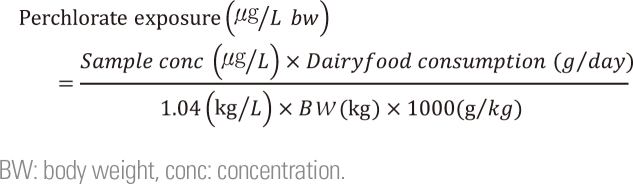
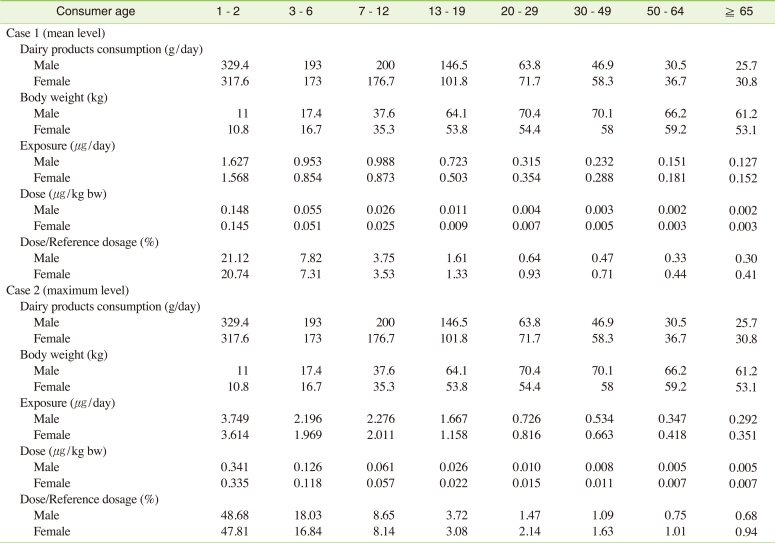
Where, sample conc. indicates the concentration of perchlorate. In the present study, the daily perchlorate exposure was determined for two scenarios by substituting the average concentration of 5.45 µg/L (case 1) and the highest concentration of 11.35 µg/L (case 2) The specific gravity of milk was set to 1.04 and then multiplied by1000 for unit revision. The data obtained from national health nutrition survey conducted by the Korean Ministry of Health and Welfare were used to determine the amount of dairy product consumption and body weight [18]. The calculated daily perchlorate exposure amounts are shown in Table 4.
The daily exposure amount of all Korean age groups was 0.002-0.148 µg/kg-day. Moreover, even when the exposure was calculated based on the maximum detected concentration value, the maximum exposure amount was 0.341 µg/kg-day, which was less than 50% of RfD (0.7 µg/kg-day) set by the NAS in USA. Accordingly, perchlorate exposure through dairy products does not currently pose a health risk in Korea. However, when the perchlorate exposure level for each age group was compared, the daily consumption of milk by infants was found to be higher than that by other age groups, and the perchlorate exposure of infants was found to be more than 70 times that of adults. Therefore, further investigation of the perchlorate exposure level through other food products is necessary.
CONCLUSIONS
These findings indicate that it is necessary to conduct perchlorate monitoring for other food products, in addition to dairy products, to determine the total perchlorate exposure from food ingestion and to assess the risk of perchlorate ingestion. Moreover, Infants and toddlers are particularly vulnerable to perchlorate; therefore, additional investigation of perchlorate exposure in young age group through baby foods is necessary.