


INTRODUCTION
Poor air quality is the main cause of serious health problems in urban areas [1]. Exposure to air pollution could have both acute (short-term) and chronic (long-term) effects. The acute effects of air pollution on human health have been proven in the twentieth century, as the severe air pollution in Europe (Meuse Valley and London) and in the United States (Donora, PA, USA) brought with it death and illness for hundreds of thousands [2,3]. The United States Environmental Protection Agency (USEPA) defined air pollutants as cancer-causing pollutants with other harmful effects on health or adverse effects on the environment [4]. Studies confirmed the relationship between air pollution and respiratory diseases, such as chronic obstructive pulmonary disease and asthma. Recent clinical and epidemiological data suggest that there may be an association between air pollution and cardiovascular disease [5]. Basic research on the epidemiology of air pollution showed that rates of disease and mortality are higher in cities with severer air pollution [6].
Today, Tehran, Iran, is known for its high levels of air pollution. Previous studies have shown that this metropolis is heavily polluted and the entire population is exposed to air pollutants exceeding the World Health Organization’s (WHO) recommended values. In 2010, the entire population of Tehran lived in areas where the WHO guidelines for 24-hour mean sulfur dioxide (SO2) and annual average PM10 were exceeded [7]. The concentration of air pollutants in Tehran was reported to be greater than in European and North American cities [8,9]. Few studies were reported on the acute effects of air pollution in Tehran [10]. A study conducted in Tehran (2012) showed that the Tehran’s mean annual PM10 is 1.3 times the world’s average and 4.5 times the WHO’s recommended values. The study also indicated that the Tehran’s mean annual nitrogen dioxide (NO2) is 2.1 times the recommended value [11]. In this case, Tehran was ranked 19th in the world as one of the largest cities in West Asia. In general, 20% of Iran’s total energy is consumed in Tehran. Pollutants such as PM10, SO2, NO2, hydrocarbon (HC), ozone (O3), and carbon monoxide (CO) are major air pollutants [12]. Considering the short-term effects, PM10 has had the most health effects on 8 700 000 residents of Tehran, causing deaths of more than 2 194 of total deaths (47 284) in the city [11]. A study on Tehran’s air pollution (SO2, NO2, CO, total suspended particulates, and HC) based on information and statistics (1988-1993) of the Department of Environment and the Ministry of Health and Medical Education, revealed a significant increase in the pollutants during the period (except NO2), and the concentration of all pollutants (except particulates) was found to have exceeded the WHO’s guidelines. According to the findings, there were growing concerns about the harmful effects of air pollution on the health of people with the increasing population growth and increasing number of cars [13].
Given such adverse effects, it is thus necessary to conduct comprehensive studies for taking urgent measures to improve air quality. Despite the many interventions and efforts to reduce air pollution in Tehran, there is a lack of more comprehensive research on the pattern of air pollution changes. A review of air pollution changes over the past decade could clarify the outcome of the previous efforts to reduce air pollution and pollutants for the policy makers involved in this area.
METHODOLOGY
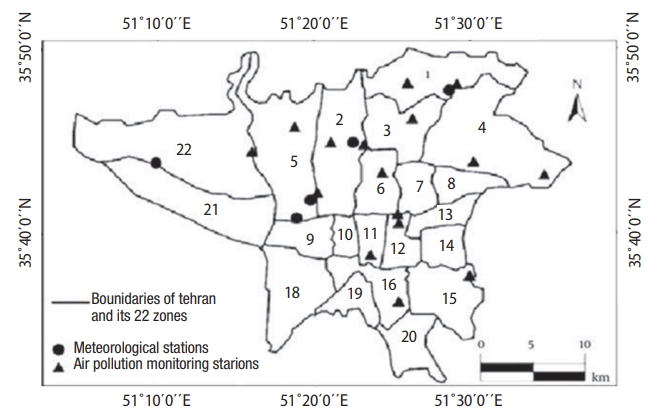
The data and information on the amount of pollutants, which were used in the present study, were obtained from the Tehran Air Quality Control Company. The data were collected from 22 stations of the company. Table 1 includes the information about the stations with related latitude and longitude.
The air quality control stations can be classified according to the location of measuring devices. Some of the stations are located next to the main streets and are mainly affected by cars and buses’ exhaust gases. The stations are Mahallati, Punak, Piroozi, Darous, Shadabad, Rey, Golbarg, and Massoudieh Station.
Some of them are located in parks or organizations, including Aqdasiyeh (in the Iran Meteorological Organization), Rose Park (inside the park), Tarbiat Modares (in the campus of the Tarbiat Modares University), Setade Bohran (in the National Disaster Management Organization Of Iran), Municipality 2, Municipality 4, Municipality 10, Municipality 11, Municipality 16, Municipality 19, Municipality 21 (inside the municipality premises), Fath Square (inside the Disaster Management Organization), and Sharif.
The stations Tarbiat Modares, Fath Square, and Sharif are located in organizations, but adjacent to the main street.
Figure 1 shows the location of the stations in the 22 Districts of Tehran.
In the present study, The USEPA Air Quality Index (AQI) was used to determine the number of clean, healthy, and unhealthy days for sensitive, unhealthy, very unhealthy, and Hazardous groups. The AQI describes the effects of different levels of air pollution on public health for precautionary measures when air pollution reaches an unhealthy level. This index measures five major air pollutants (CO, NO2, SO2, O3, and PM10) and converts their concentrations into a number ranging 0-500. The most significant number in this range is 100. If AQI >100, then the pollutant is in an unhealthy range. If AQI≤100, it is in a healthy range. AQI≤50 represents clean air. 51≤AQI≤100 is indicative of healthy air quality. 101≤AQI≤150 indicates that air quality is unhealthy for the sensitive group, including children, the elderly, pregnant women, and patients with cardiovascular disease. 151≤AQI≤200 represents unhealthy air, showing that the health of all groups is at risk and the sensitive group may be face a more serious danger. 201≤AQI≤300 includes a very unhealthy level of pollution. Finally, 301≤AQI≤500 means dangerous levels.
The data obtained from the Air Quality Control Company on daily concentrations of CO, NO2, SO2, O3, PM10 and PM2.5 (from the beginning of 2005 to the end of 2014) were analyzed using SPSS 16 based on the statistical method, repeated measures, and intra-group test to determine the pattern of each pollutant changes and to measure the effect of some variables in this regard, such as the consumption of domestically produced petrol due to international sanctions.
The pattern of changes in the concentration of pollutants over 10 years was also examined. For each day, the mean of each pollutant concentrations was calculated in all the 22 stations. Part of the meteorological data was also used to validate the results when necessary.
RESULTS
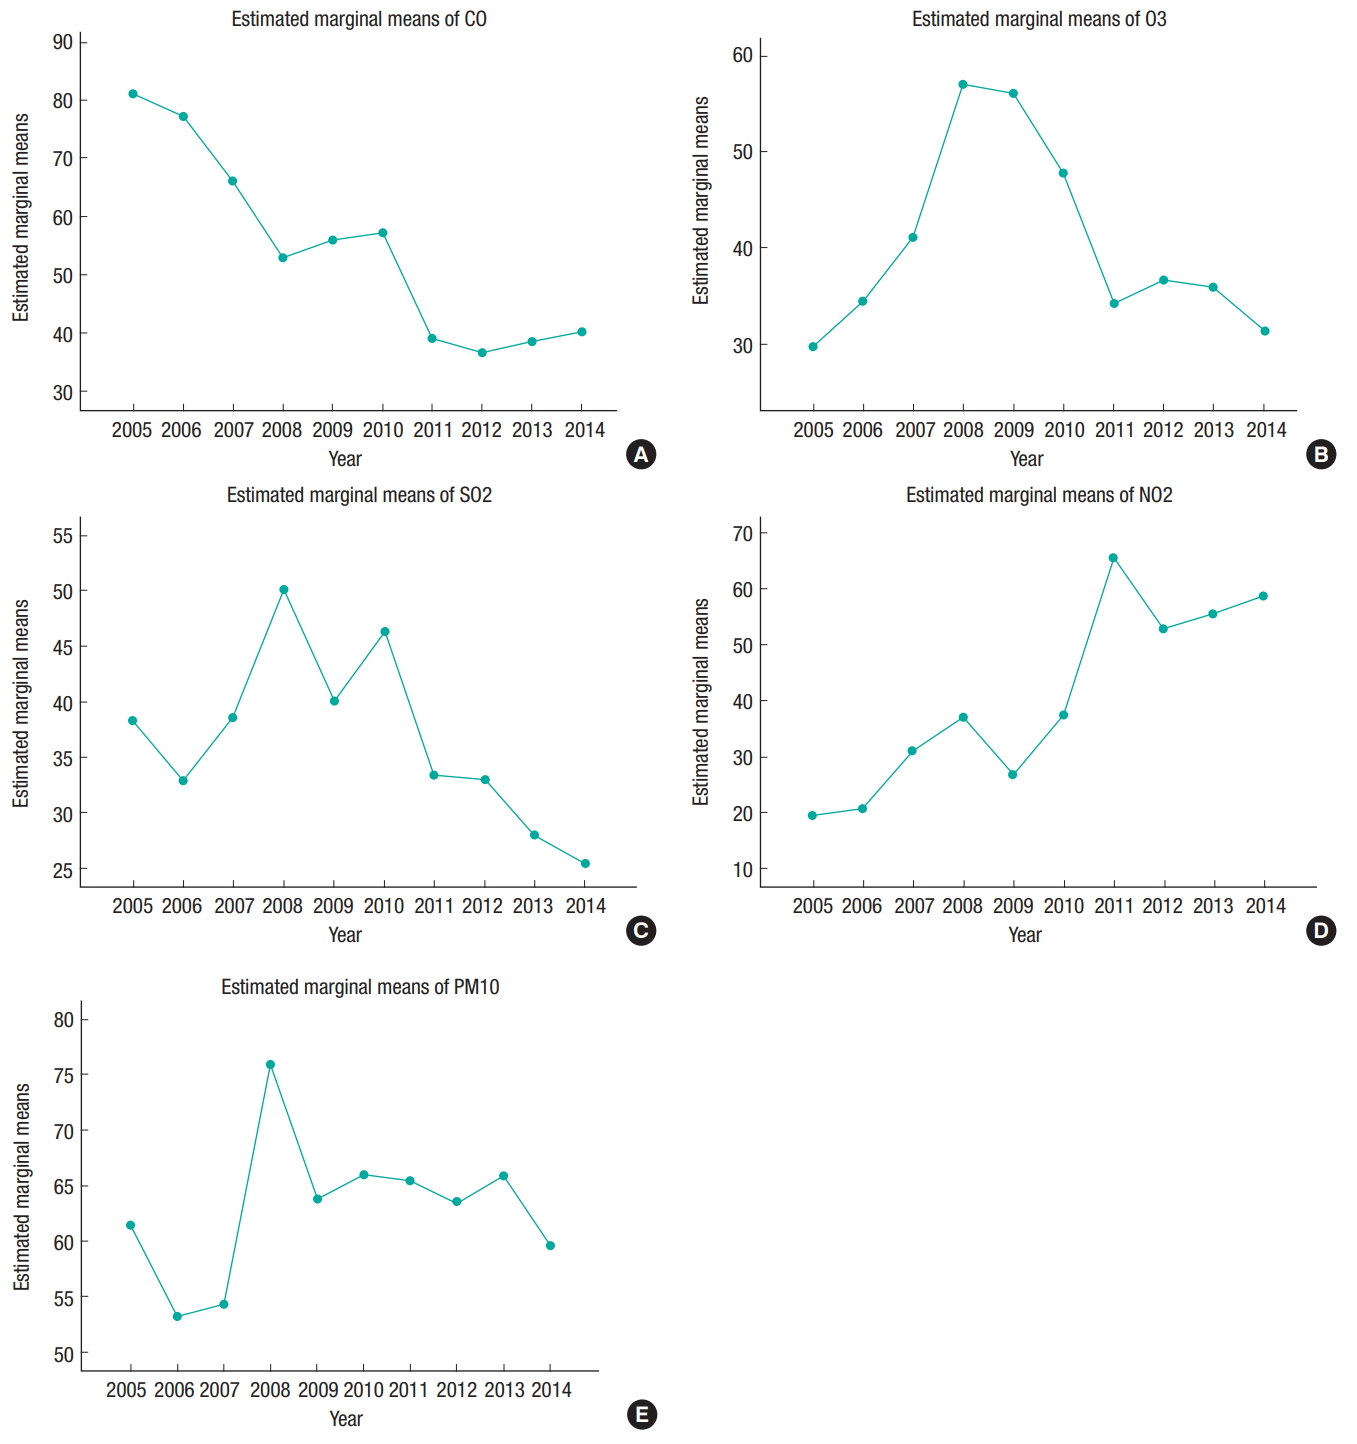
According to the results obtained over the past 10 years (2005-2014), the mean concentration of CO significantly decreased from 80 to about 40 ppm (using ANOVA, repeated measures, and Greenhouse-Geisser correction, F [5.794, 2108.921]=414.966, p<0.0005). However, the concentration of this pollutant has been steadily increasing during 2007-2009 and 2012-2014.
The mean concentration of O3 significantly increased from 2005 to 2008, while it dropped dramatically from 2008 to 2014. (F [5.680, 206.341]=329.727, p<0.0005).
Unlike CO and O3 that have been decreasing over the period, the mean concentration of NO2 has risen in recent years, especially between 2009 and 2011. The pattern of changes has been dramatically rising and, consequently, the chart has a steep slope in this range. In 2011-2012, the slope is negative as the NO2 level partly decreased. Nevertheless, the changes formed an ascending pattern in the next years using ANOVA, repeated measures, and Greenhouse-Geisser correction, the mean concentration of NO2 has changed significantly (F [3.730, 1357.686]=832.380, p<0.0005).
According to the average of SO2 values over the period, the mean concentration has significantly decreased in general. The maximum level of this pollutant is seen in 2008 and 2010, whereas its amount has reached its lowest level in 2014 (F [5.859, 2120.967]=343.185, p>0.0005). The mean value of PM10 slightly dropped in the past 10 years, and the maximum is seen in 2008. Since then, PM10 has been decreasing (F [7.24, 2636.080]=39.814, p<0.0005). Figure 2 shows the pattern of pollutant changes over the period under study.
Table 2 includes the number of clean, healthy, and unhealthy days for sensitive, unhealthy, very unhealthy, and dangerous groups in the years 2005-2014. According to the table, the maximum number of clean days was in 2007 and the minimum number of unhealthy days for sensitive groups was in 2009. In addition, the latter year included no unhealthy, very unhealthy, and dangerous days. The air quality is in the range of very unhealthy days for sensitive groups in some days of 2008, 2009, 2010, 2011, and 2012, while it is seen in the dangerous group only once in 2009.
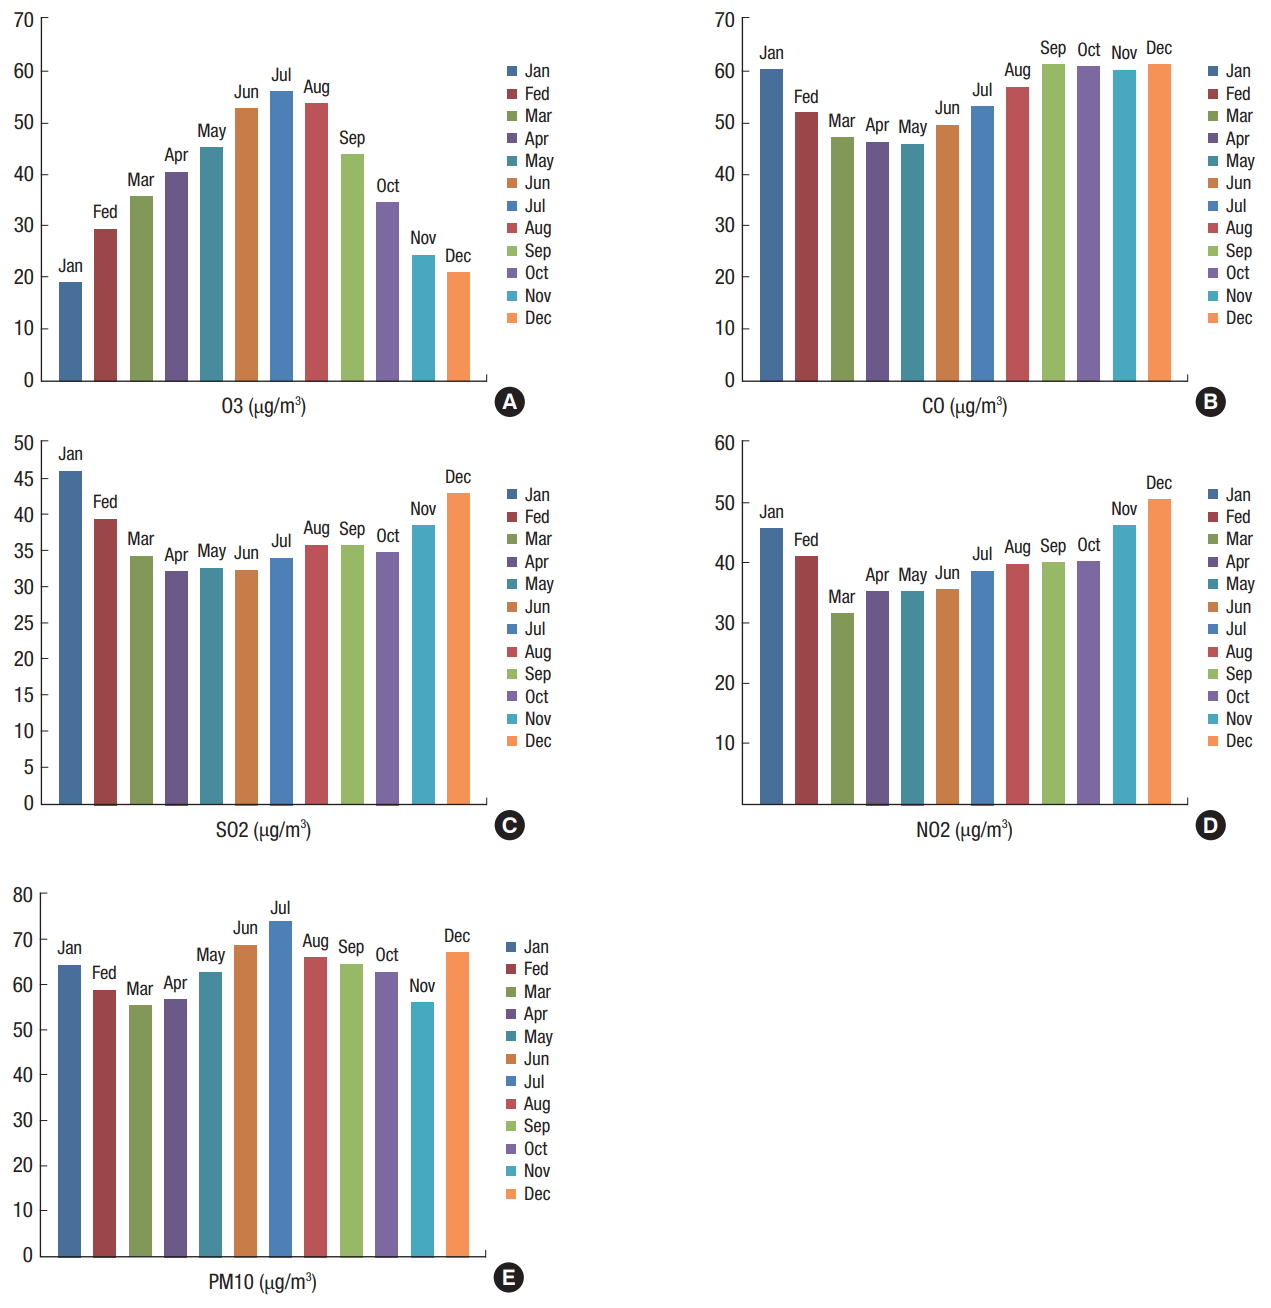
Table 3 shows the average monthly concentrations of CO, PM10, SO2, O3, and NO2 over the period. The highest levels of CO are seen in September, October, December, and January, respectively. The lowest levels of O3 are in January, December, and November, respectively. The maximum NO2 is in December, and the minimum is in March. The maximum SO2 is in January and December, respectively. The concentration of PM10 is higher than the other pollutants in almost all months with no significant difference except in July, when the maximum amount of this pollutant was reported. Figure 3 shows the concentration changes in different months for each pollutant.
DISCUSSION
The results of the present study showed that NO2 Concentrations have been increasing over the period of 10 years. The highest anomaly is related to SO2. The CO concentrations represent a descending pattern over the period, although there was a slight increase in 2013 and 2014. Generally, CO levels have dropped significantly over the past 10 years. According to the study findings, the O3 concentrations increased between 2005 and 2009, but declined in the following years. The average concentration of PM10 has been rising during the period, with its peak in 2008. The CO concentration has dropped over the period, the main reasons for which are development of advanced automobile technologies, disposal of worn out vehicles, and mandatory technical inspection for vehicles over the past few years. Moreover, the implementation of the Low Emission Zone (LEZ) scheme has contributed to the removal of polluting vehicles and, consequently, improved air pollution in the long term. The LEZ is an urban zone where a group of vehicles is not allowed for environmental reasons. This restriction can be permanent, temporary, 24-hour, or on an hourly basis for all or a group of vehicles. The zone can include a small area or the entire city. According to 2013 Regulations, Tehran’s LEZ was the area where cars are allowed on alternate days based on their odd-even plate numbers. The vehicles without technical inspection certificate are not allowed to enter the zone since October 2016.
Similar to such schemes, a reduction in urban polluters like plants and industries located in urban areas has potentially a direct and major anti-pollution effect. To eliminate the fixed sources of pollution such as polluting factories and plants is to fight air pollution directly. In recent years, the expansion of public transport lines, especially the subway system throughout Tehran, has resulted in a growing public use of subway instead of cars for personal reasons. According to Amini et al. (2014), a study including regression models for estimating annual and seasonal changes in SO2 and PM10 in Tehran, the average annual concentration of SO2 and PM10 was 38 ppb and 100.8 μg/m3 respectively in 21 stations with a mean concentration of 35.6-40.4 and 100.4-101.2 in warm and cold seasons [7].
In a study on the pattern of changes in five major pollutants (CO, NO2, SO2, PM10, and O3) of the AQI and its relationship with the meteorological data in Tehran during 2001-2009, Najafpour et al. (2015) found an increase in the O3 concentration. They also found a descending pattern of changes for NO2, SO2, and PM10 during the period. Accordingly, Tehran’s air quality generally improved in terms of the mentioned pollutants, while the O3 concentration has been rising and exceeding the standards [14]. Baldasano et al. (2003), “Air quality data from large cities” in developed and developing countries, showed that the pattern of SO2 changes is a descending pattern all over the world, the NO2 levels are close to the global standard, and particulates are a major problem in all Asian countries and North American cities, the average amount of which was estimated to be about 300 μg/m3 [15].
Doosti et al. (2013) studied the changes in the standard air pollution index in Tehran during 2002-2012. They found a decrease in the concentration of CO and an increase in the concentration of PM2.5. The latter pollutant can be thus considered to be the main cause for increased index in recent years in Tehran [16].
The results of the present study show that there were only 2 and 7 clean days in 2011 and 2012 respectively. The results also indicate that the maximum number of clean days was in 2007, which can be thus regarded as the healthiest year in terms of pollution over the past decade. The minimum number of clean days is found in 2012 and 2013. The international sanctions imposed in 2011 have also contributed to air pollution. Doosti et al. (2013) also found that there was an unhealthy air quality in, on average, 31.5% of days in the studied years, and some years only included 3 clean days (2011 and 2012) [16].
According to the present study, December is the most polluted month in terms of pollutants, including CO, NO2, SO2, and PM10. The CO concentration has increased significantly since December in every year, which may be attributed to the reopening of schools and the resulting increased traffic. Furthermore, inversion has been a contributor to air pollution in cold seasons. Unlike the other pollutants with high levels in cold months, O3 showed the highest levels in summer months, which can be due to increased solar radiation and photochemical activity.
Doosti et al. (2013) suggests that the summer and winter months, especially September, include the most polluted days of year, whereas spring months, especially April, were the cleanest months during 2002-2012 [16].
Shar’ipour and Ali Akbari (2014) focused on the spatial-temporal distribution of air pollutants in Tehran during the cold months of 2011-2013. They found the acute effects of air pollution during Decembers [17].
One of the strengths of the present study is the accurate collection of 10-year data from the Air Quality Control Organization for evaluation and comparison. The present study thus both explained the pattern of pollution changes in the past 10 years and compared the number of all months and years in terms of changes.
However, the study was also subject to some limitations, including the fact that PM2.5 information was only available for 4 years that led to its exclusion from the study. Another limitation was the number of the control stations, as there are only 22 stations in Tehran. A larger number might have provided the possibility for more effective sampling and more measurements in different areas of Tehran, which in turn could have improved the study results.
CONCLUSION
In conclusion, in 10 studied years CO and SO2 decreased, O3 had a sinusoidal pattern, NO2 increased and PM10 slightly dropped. Indicating an increase in the concentration of some pollutants and a decrease in the number of clean days in recent years, the study findings illustrated the necessity for larger investment in air pollution abatement.