


Introduction
Nearly a third of all known amphibian species are threatened with extinction worldwide [1] and about 41% of known amphibian species are experiencing population loss [2]. According to the International Union for Conservation of Nature (IUCN) Red List, due to rapid increase in anthropogenic activities, about 20 countries have threatened species and the numbers are projected to increase [2]. Environmental pollution has been reported as one of the drivers of amphibian population decline [3]. The rate and extent of declines have been recorded to be far more dramatic than those described for reptiles, birds, or mammals [4]. Climate change, introduction of exotic species, exposure to ultraviolet radiation, food scarcity, road-kills, diseases, increased predation, loss of habitat, habitat fragmentation and disturbance due to contamination have been noted as the causes of global amphibian population decline [5–7].
One of the most hazardous anthropogenic activities threatening amphibian populations is agriculture [8] and the sensitivity of many Anuran species to different agrochemicals have been the subject of several studies [9,10]. Among the widely distributed Anurans in Sub-Saharan Africa is the African common toad, Amietophrynus regularis, with its range extending to Algeria and Libya as well as to northern Nilotic Egypt [9]. It is an adaptable species with a stable population, such that the IUCN has listed its conservation status as being of least concern. However, agricultural settings interphases with their natural habitat, and human continual encroach into natural forests and savanna, increases the risk of harm from agrochemicals due to levels of misuse, abuse and overuse [11]. Therefore, the selection of this species was based on its common distribution which are mostly associated with agriculture.
It is estimated that about 125,000–130,000 metric ton pesticides are applied annually in Nigeria [12]. Among the most commonly applied broad-spectrum pesticides are Dichlorvos and Paraquat. Dichlorvos (2, 2-dichlorovinyl dimethyl phosphate), is an insecticide known to exert its toxic effect by irreversibly inhibiting neural acetylcholinesterase, thereby, disrupting nerve function in exposed organisms [15]. Paraquat (1,1’-dimethyl-4,4′-bipyridinium dichloride) on the other hand is an herbicide which belongs to the “bipyridylium” (BP) or “viologen” salts, a group of compounds that have been known for their redox-active properties. The ability of BP salt compounds to accept or release an electron in biochemical systems have long been considered the first action responsible for paraquat toxicity in animals and plants [16].
Both pesticides have been banned commercially in the European Union since 1998 and 2007, respectively. They have also been banned or restricted in Nigeria by the Federal Government due to their toxicity and prevalence in urban and rural waterways [12,13]. Despite restrictions, both pesticides remain commercially available to farmers where they are widely applied in insect-pest and weed control, respectively.
The acute toxicity of Dichlorvos has been widely reported, with 96 h LC50 values ranging from 0.2 to 12 mg/L for freshwater and estuarine animals [14]. Dichlorvos has been regarded by the International Agency for Research on Cancer (IARC) as a possible carcinogen for humans (Group 2B) and the US Environmental Protection Agency (EPA) also considered it a probable carcinogen (Group B2) [15]. Paraquat has been shown to be moderately toxic freshwater fish species [17]. Osano et al. [18] in a study noted the teratogenicity and acute toxicity of environmentally relevant concentrations of Paraquat amongst other pesticides to tadpoles of Xenopus laevis. Despite the usefulness of findings as these, they do not represent the full range of responses which fauna such as amphibians can display in relation to pesticide exposure.
Classic whole organism toxicity evaluation often involves static bioassays using forced exposures to toxicants within compartments. Although this has the potential to clearly define dose-response relationships, it does not reflect the true behavioral repertoire of living organisms in field conditions. It is apparent that when living organisms are exposed to considerable toxicant concentrations continuously, they often have the ability to avoid such [19]. A typical behavioral adjustment to such exposures involves changes in the movement patterns in organisms and such spatial responses have been employed in modern toxicological response evaluations [20]. Although it is expected that no long-term effect will occur due to the short-term pulse contact with contaminants, the migration of part or entire populations could be just as dangerous as the death of the organism [20]. The cascading impacts includes a reduction in biodiversity due to disappearance of the exposed organisms, and the disruption of ecosystem structure and function.
Over the years, a range of techniques have been developed and modified for evaluation of active avoidance, via: fluvarium systems, two compartments, steep gradients, avoidance/preference chambers, laminar flow chambers and dilution gradients involving several compartments [21–27]. Lopes et al. [28] developed a consistent and reliable non-forced, multi-compartmented exposure system (NFS) for assessment of spatial avoidance and habitat preference in organisms exposed to toxicants. This technique has been employed in studies involving fishes, amphibians, decapods, copepods, annelids, crustaceans, and dipterans [26,29–35]. More so, Ehiguese et al. [35] noted the relevance of this technique as a realistic tool for environmental regulators. In view of the simplicity of the NFS, its use in developing countries in evaluating risks of agrochemicals to native species decline will be of immense value as agricultural activities intensifies. Thus, this study sought to employ FS and NFS tests to examine the risks posed to the tadpoles of the common African toad exposed to Dichlorvos and Paraquat, as well as ascertain the contribution of both pesticides to their PID. More so, there is a dearth of information of the spatial avoidance of tadpoles upon pesticides exposure in NFS, especially in tropics of developing countries where environmental regulations are weak and simple realistic tools for environmental risk evaluation are in short supply.
Materials and Methods
Test organism: collection and acclimatization
Feral tadpoles of African common toad, Amietrophynus regularis Reuss, 1833 were obtained early in the morning from an undisturbed pond within the Centre for Distant Learning, University of Lagos Campus, Lagos, Nigeria (GPS: 6°30′44.5″N 3°23′28.2″E) in December 2019. They were transported to the Ecotoxicology and Conservation unit Laboratory, University of Lagos. Tadpoles were transferred into a 40 L capacity holding tank (l × w × h = 60 cm × 35 cm × 30 cm) half filled with dechlorinated tap water and aerated with a 220-v air pump (Cosmo aquarium air pump- double type 12000) to maintain levels of dissolved oxygen. They were acclimatized for seven days based on OECD Test 203 [36] Guideline and fed once daily ad libitum with Coppens® fish feed containing 45% crude protein. The culture water was changed every 48 hours to prevent the buildup of metabolic and food wastes [37]. The mean physicochemical parameters of culture water were measured using a Horiba U50 water quality monitor. Observed readings were: Dissolved Oxygen (DO) 3.5 mg/L, Temperature 25.60 °C, pH 8.72, TDS 6.29 g/L, Salinity 5.7ppt. Test organisms were active and the mean total length (tip of head to tip of tail) observed after acclimatization was 0.78±0.13 cm. Feeding stopped in holding tanks 24 hours prior to exposure. The acclimatization of test organisms was under stable laboratory conditions (Temperature 26±3.0°C and a 12:12 hours photoperiod). No deaths were recorded during the acclimation period.
Test chemicals
Pesticides used for this study were Sniper, an emulsifiable concentrate (EC) containing 1000 g/L DDVP manufactured by Forward (Beihai) Hepu Pesticide Co. Ltd, Beihai, Guangxi, China and ParaeForce, manufactured by Nanjing Redsun Biochemistry Co. Ltd, Nanjing City, China (active ingredient 276 g of Paraquat dichloride (200 g Paraquat). These commercially available brands of Dichlorvos and Paraquat were obtained from Everbright Industries Limited Mushin, Lagos State, Nigeria. Stock solutions of 1 g/L were prepared and diluted using distilled water from which pre-determined concentrations (Dichlorvos: 0.3, 0.5, 0.7, 1.0 and 2.0 mg/L; Paraquat: 1, 5, 10, 15 and 20 mg/L) were prepared.
Acute toxicity (FS) tests
A range finding test was carried out over 96 hours to derive lethal concentrations of Dichlorvos and Paraquat to tadpoles. The derived concentrations (Dichlorvos: 0.3, 0.5, 0.7, 1.0 and 2.0 mg/L; Paraquat: 1, 5, 10, 15 and 20 mg/L) were used to evaluate the acute toxicity of dichlorvos and Paraquat to Amietophrynus regularis. Glass aquaria (l × w × h = 6 cm × 6 cm × 7 cm) were used as treatment tanks. Each setup was in quadruplicate with three active tadpoles (mean total length = 0.78±0.13 cm) randomly introduced per aquarium, totalling 12 tadpoles per treatment. Mortality was observed and recorded at 24 and 48 h, and tadpoles were considered dead when there was no movement after gentle prodding with a glass rod. The experiment was conducted under the same laboratory conditions as acclimatization.
Non-forced multi-compartment exposure system for avoidance
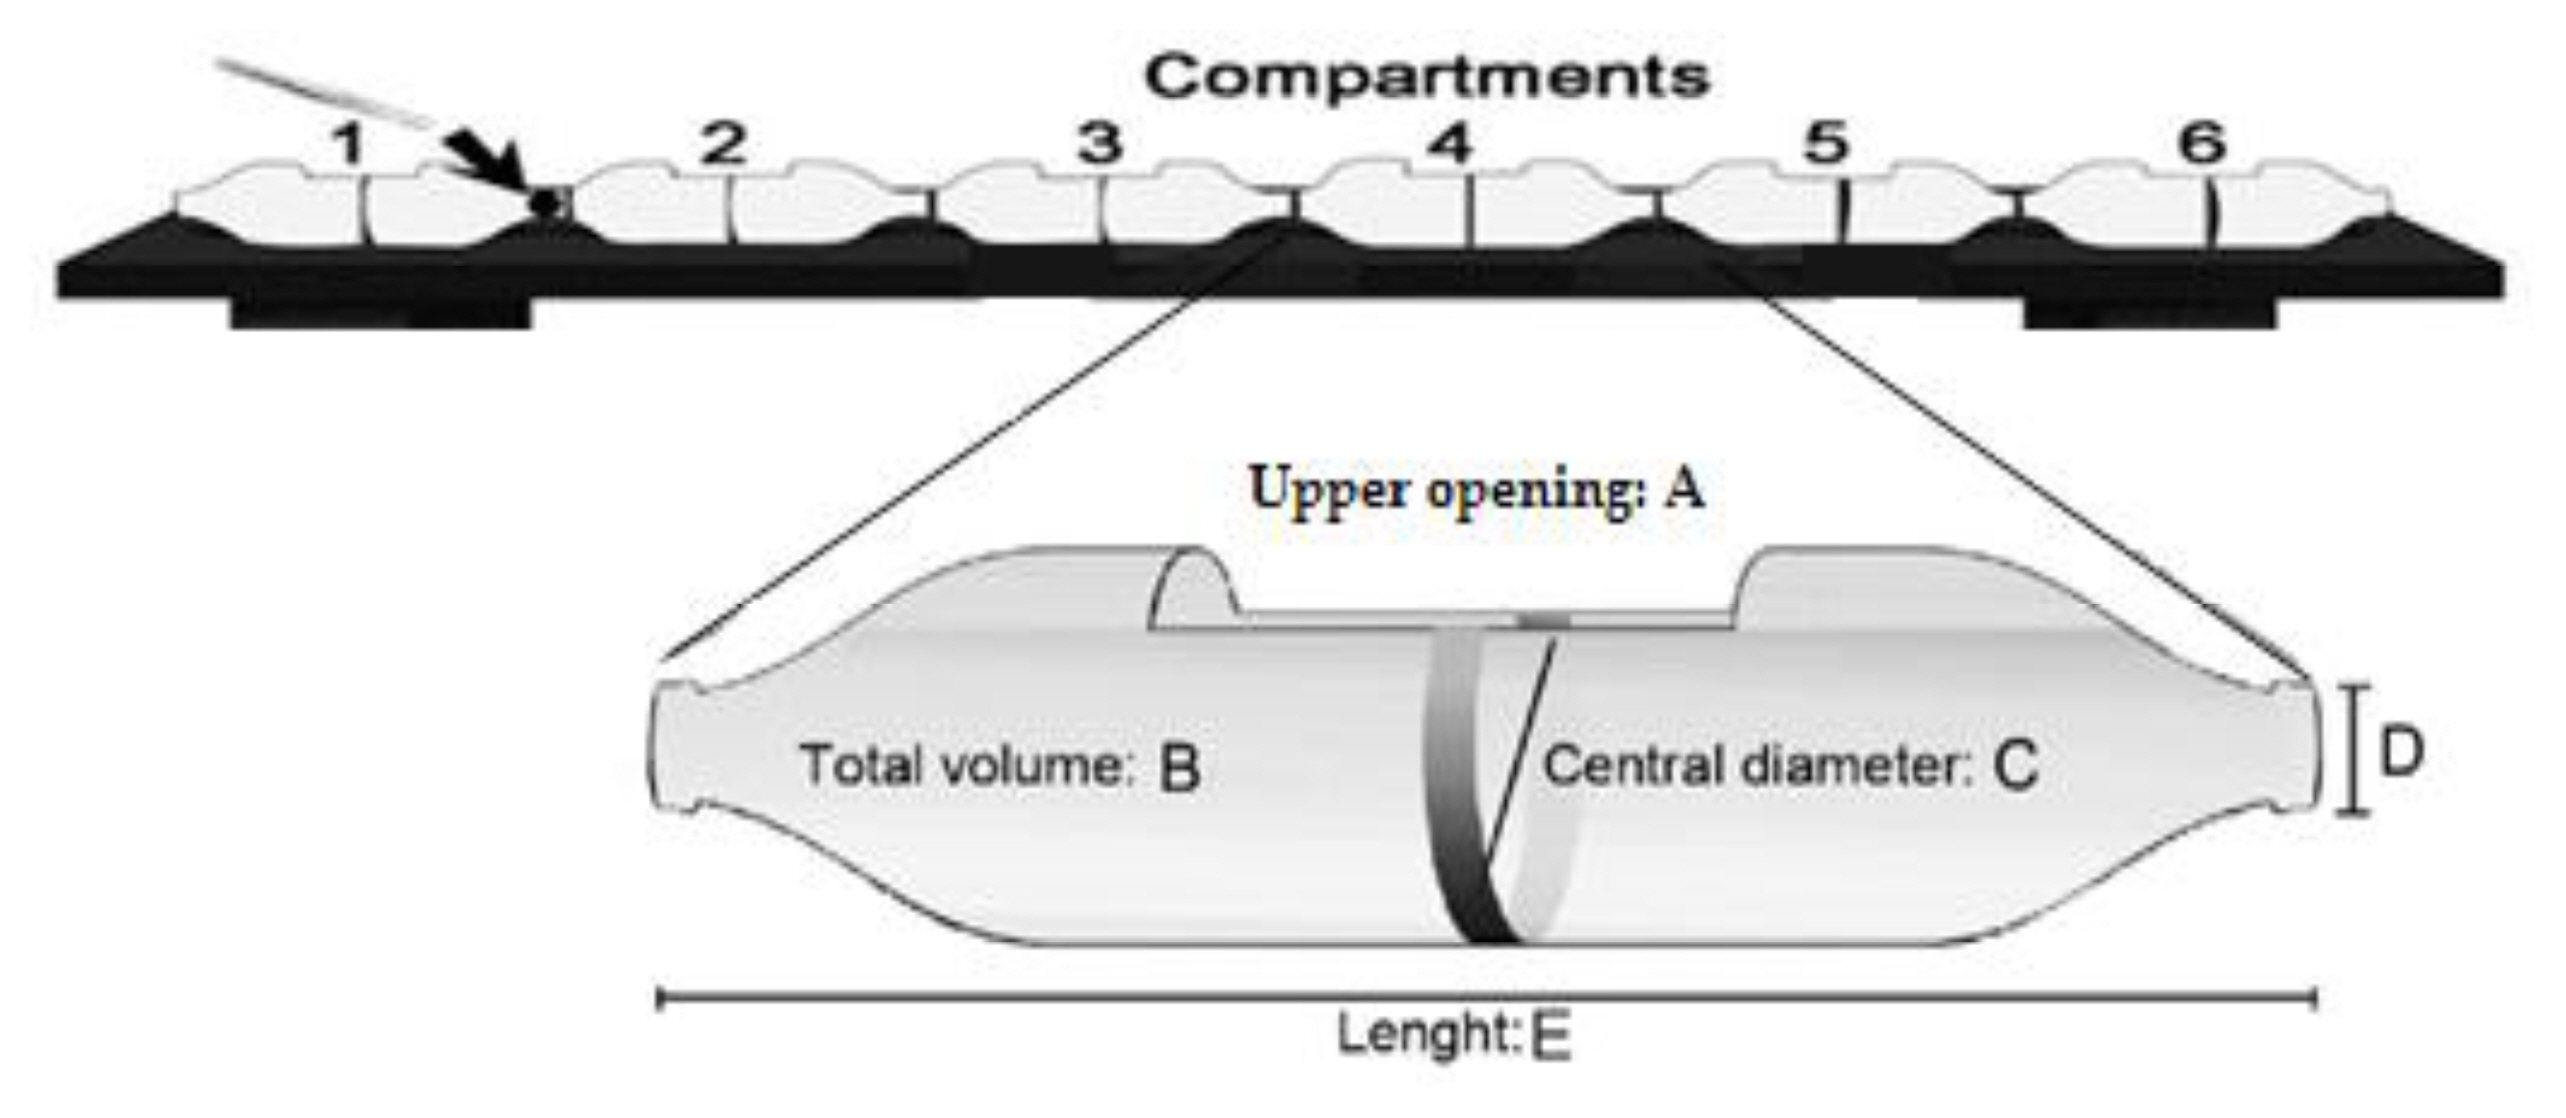
A multi-compartmented non-confined static assay system (Figure 1) was used for avoidance assays [49]. Respective systems were constructed from plastic bottles, each connected at the cut-out bases and mouths using plastic glue (Zuma PVC glue, Ogun, Nigeria) to obtain a six-compartment system [49]. The top of each compartment was also cut open to facilitate the introduction of pesticides and tadpoles. Four systems in total were constructed and utilized in the present study.
More so, a pre-test using NaCl gradient across all six compartments was set up to determine if there will be significant movement of the test chemicals across the compartments within the proposed 3 h test period. Once the system was found to maintain stability of the gradient within 3 h, the definitive avoidance experiment was initiated.
Avoidance tests (NFS)
In the absence of contamination, a control assay was performed using only freshwater in order to ascertain non-interference of external factors with the distribution of tadpoles and to confirm the random spatial distribution of tadpoles (without preference or avoidance of any compartment in exposure systems). Tadpoles (n=3) were introduced into each compartment filled with 1 L of freshwater, making a total of 18 organisms per system (3 tadpoles × 6 compartments) in quadruplicate.
Avoidance assays were performed with Dichlorvos in a contaminant gradient of 0 (dechlorinated water), 0.3, 0.5, 0.7, 1.0 and 2.0 mg/L; and Paraquat in a contaminant gradient of 0 (dechlorinated water), 1, 5, 10, 15 and 20 mg/L. Plasticine plugs were fitted at the connecting junctions of each compartment and 1 L of freshwater spiked with concentrations of each contaminant were dispensed into the compartments forming a contamination gradient. Three active tadpoles (n=3) were introduced into each compartment after which plasticine plugs were removed. For each pesticide, the experiment was carried out in quadruplicate with a total of 18 tadpoles per system and 72 per experiment (3 tadpoles × 6 compartments × 4 systems). The experiment was carried out in the dark under laboratory condition (26 °C) and the distribution of organisms were observed and recorded over 3 h period at 20 mins interval.
Statistical analysis
Statistical analyses were performed using SPSS® 23.0 for windows. The mortality data observed in each toxicant concentration and control groups during acute assays (forced) were computed and analyzed using probit regression analysis including regression line equation [38]. The indices of toxicity measurement derived from these analyses were LC50, confidence intervals, and Toxicity Factor (T.F) which is a measure of relative potency of toxicants.
The percentage distribution of tadpoles observed in each compartment at different time periods of observation were arcsine transformed. The random distribution of tadpoles in control (pre-test) and avoidance experiments using contaminants were measured using mixed-designed one-way analysis of variance (ANOVA) with time as a repeated measure, within factor and compartments as between factors. Mauchly’s test was used to check the sphericity of distribution, and where sphericity was violated (where the variances of the differences are not equal: p<0.05), Greenhouse-Geisser correction was applied [35] (Tables S3a, S4a and S5a-Supplementary Material). When there were statistical (p<0.05) differences between factors, Bonferronni test was applied.
For avoidance measurements, the difference between the final number of expected organisms (NE) and the final number of observed alive organisms (NO) was used in calculating the number of avoiders in each compartment (i.e., Avoiders=NE − NO). NE was determined as described by Moreira-Santos et al. [26]. For the compartment with the highest concentration, NE was equal to the number of tadpoles introduced into the compartment at the start of the test. For the remaining compartments, NE includes the tadpoles introduced originally in the compartment plus the tadpoles introduced in the adjacent compartments of higher concentrations. At the start of the experiment, all compartment each had 3 tadpoles; thus, NE was 3 for the highest pesticide concentration. For the adjacent compartment (second compartment) NE was 6 (i.e., 3 tadpoles from the highest concentration plus 3 tadpoles in the adjacent concentration) and for the last (sixth) compartment (i.e., uncontaminated compartment) it was 18, which means that there was zero avoidance in the uncontaminated compartment. This was so because the uncontaminated compartment contained only freshwater and so, no avoidance is expected. The avoidance percentage for each compartment was calculated using (Avoiders/NE) *100. AC50 values (concentration causing avoidance by 50% of the exposed organisms) and their corresponding 95% confidence intervals were estimated using avoidance percentages for each concentration, and analyzed via probit regression analysis.
Avoidance and mortality percentages were integrated in order to calculate the PIDx (x in percent), using y mortality percentage (i.e., the 48 h LCy) and a w avoidance percentage (i.e., the 3 h ACw) [29]: X = [1 − (1 − y/100) * (1 − w/100)] *100.
The PID calculations were based on the premise that some of the tadpoles will first flee (avoidance %), and that mortality is then determined as a function of organisms that did not show avoidance by remaining behind [35]. The PID50 values (the concentration causing a population immediate decline of 50% of the exposed organisms) and the corresponding CI were also obtained using probit regression analysis.
Results
Acute toxicity responses
The results from the FS exposure to Dichlorvos indicated a concentration-dependent relationship with percentage mortality of the tadpoles ranging from 31.2% to 62.5% (Table S1a -Supplementary material). Paraquat induced zero mortality in 1 mg/L treatment and in other treatments (5 –15 mg/L) percentage mortality was dose-dependent and ranged between 25% and 100% (Table S1b-Supplementary material). The 48 h LC50 values were 0.787 mg/L and 6.46 mg/L for Dichlorvos and Paraquat respectively Table 1. Overall, Dichlorvos was approximately 8 times more toxic than Paraquat.
Avoidance response
The NaCl gradient in the pre-test experimental systems was maintained and remained stable over the 3 h experimental period Table 2. Also, a significant difference was observed in the NaCl concentrations between compartments (LSD and Tukey Multiple Comparison Test: F(5,18)=755.02, p<0.00001) after 3 h and the measured concentrations were similar to those at start of the experiment (0 h).
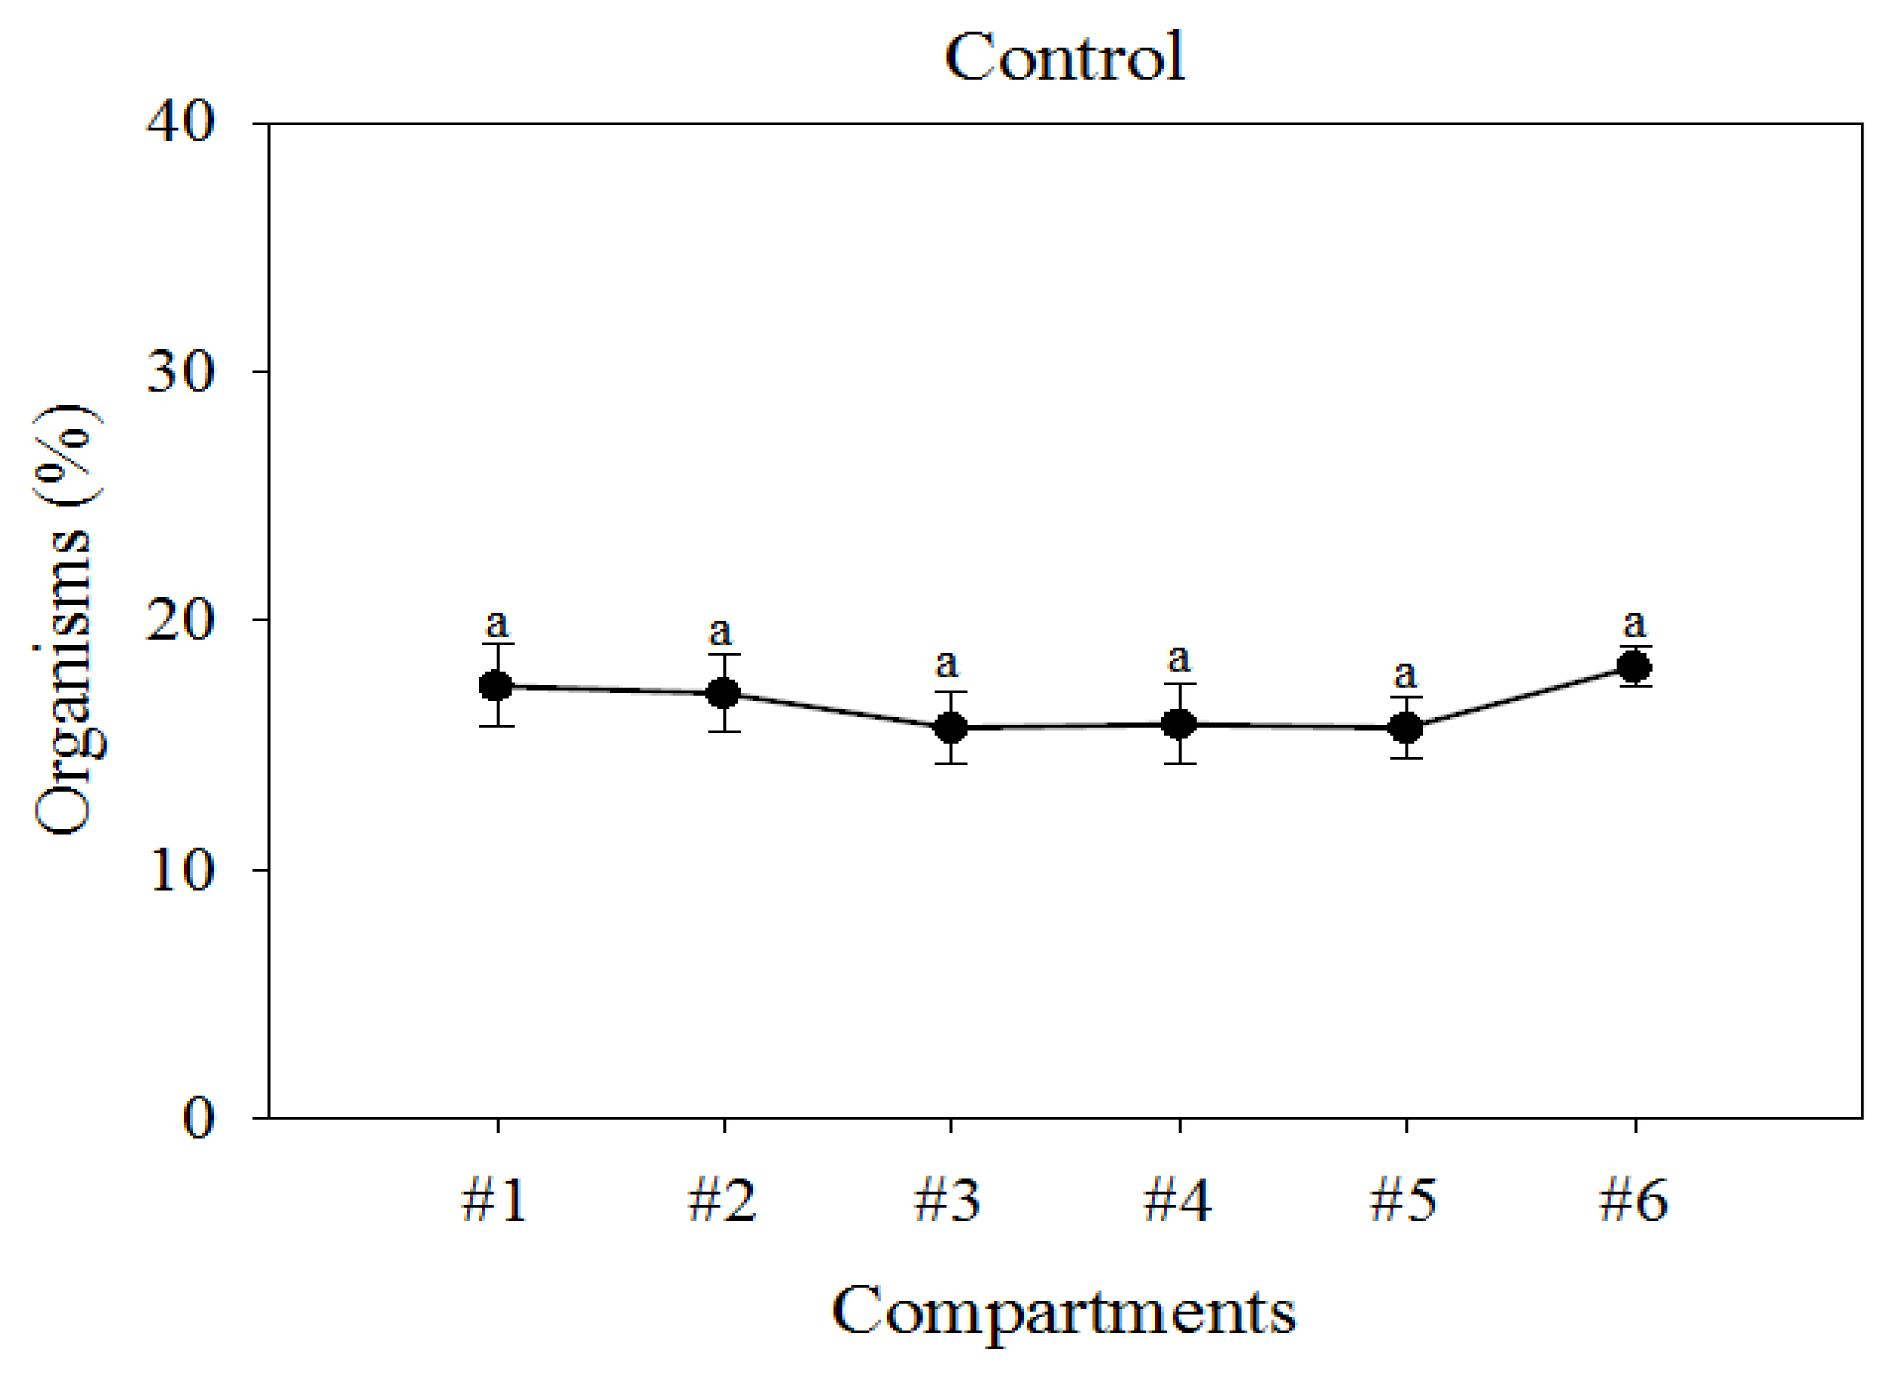
The mean number of organisms distributed in the control experiment over 3 h without toxicants was not statistically different (F(5,18)=0.629, p=0.956) and the distribution of tadpoles between compartments was not significant (p=0.102) (Tables S3b and S3c-Supplementary material). The mean distribution (±Standard deviation) of tadpoles in each one of the six compartments after 3 h were: 3.25±0.5, 2.75±0.96, 3±0.81, 2.5±0.56, 3.25±0.5, and 3.25±0.5 (n=3). Relative frequencies (%) of organisms observed in each compartment in control experiments after 3 h is plotted Figure 2.
No mortality was observed during avoidance (NFS) experiment with each pesticide. Organisms exposed in the avoidance system were able to evade contaminated compartments by moving towards less contaminated and uncontaminated compartments in both experiments Figure 3. The distribution of tadpole in experiment with each pesticide varied significantly (p<0.05) over time (Tables S4b and S5b-Supplementary material). Preference for less contaminated compartments by tadpoles after 3 h exposure to the contaminant gradients of Dichlorvos (F(5,18)=86.58, p<0.005) and Paraquat (F(5,18)=121.22, p<0.005) were also statistically significant (p<0.05) (Tables S4c and S5c-Supplementary material). The mean percentage distribution of A. regularis exposed to Dichlorvos was not concentration dependent, and for Paraquat however, the distribution was clearly concentration-dependent. The mean percentage distribution of tadpoles along the NFS after 3 h was about 58% and 69% in the uncontaminated compartments, while that recorded for compartments with the highest concentrations (Dichlorvos: 2 mg/L and Paraquat: 20 mg/L) were about 11% and 0% respectively Figure 3.
Population immediate decline (PID) and median responses (AC50, LC50, AND PID50)
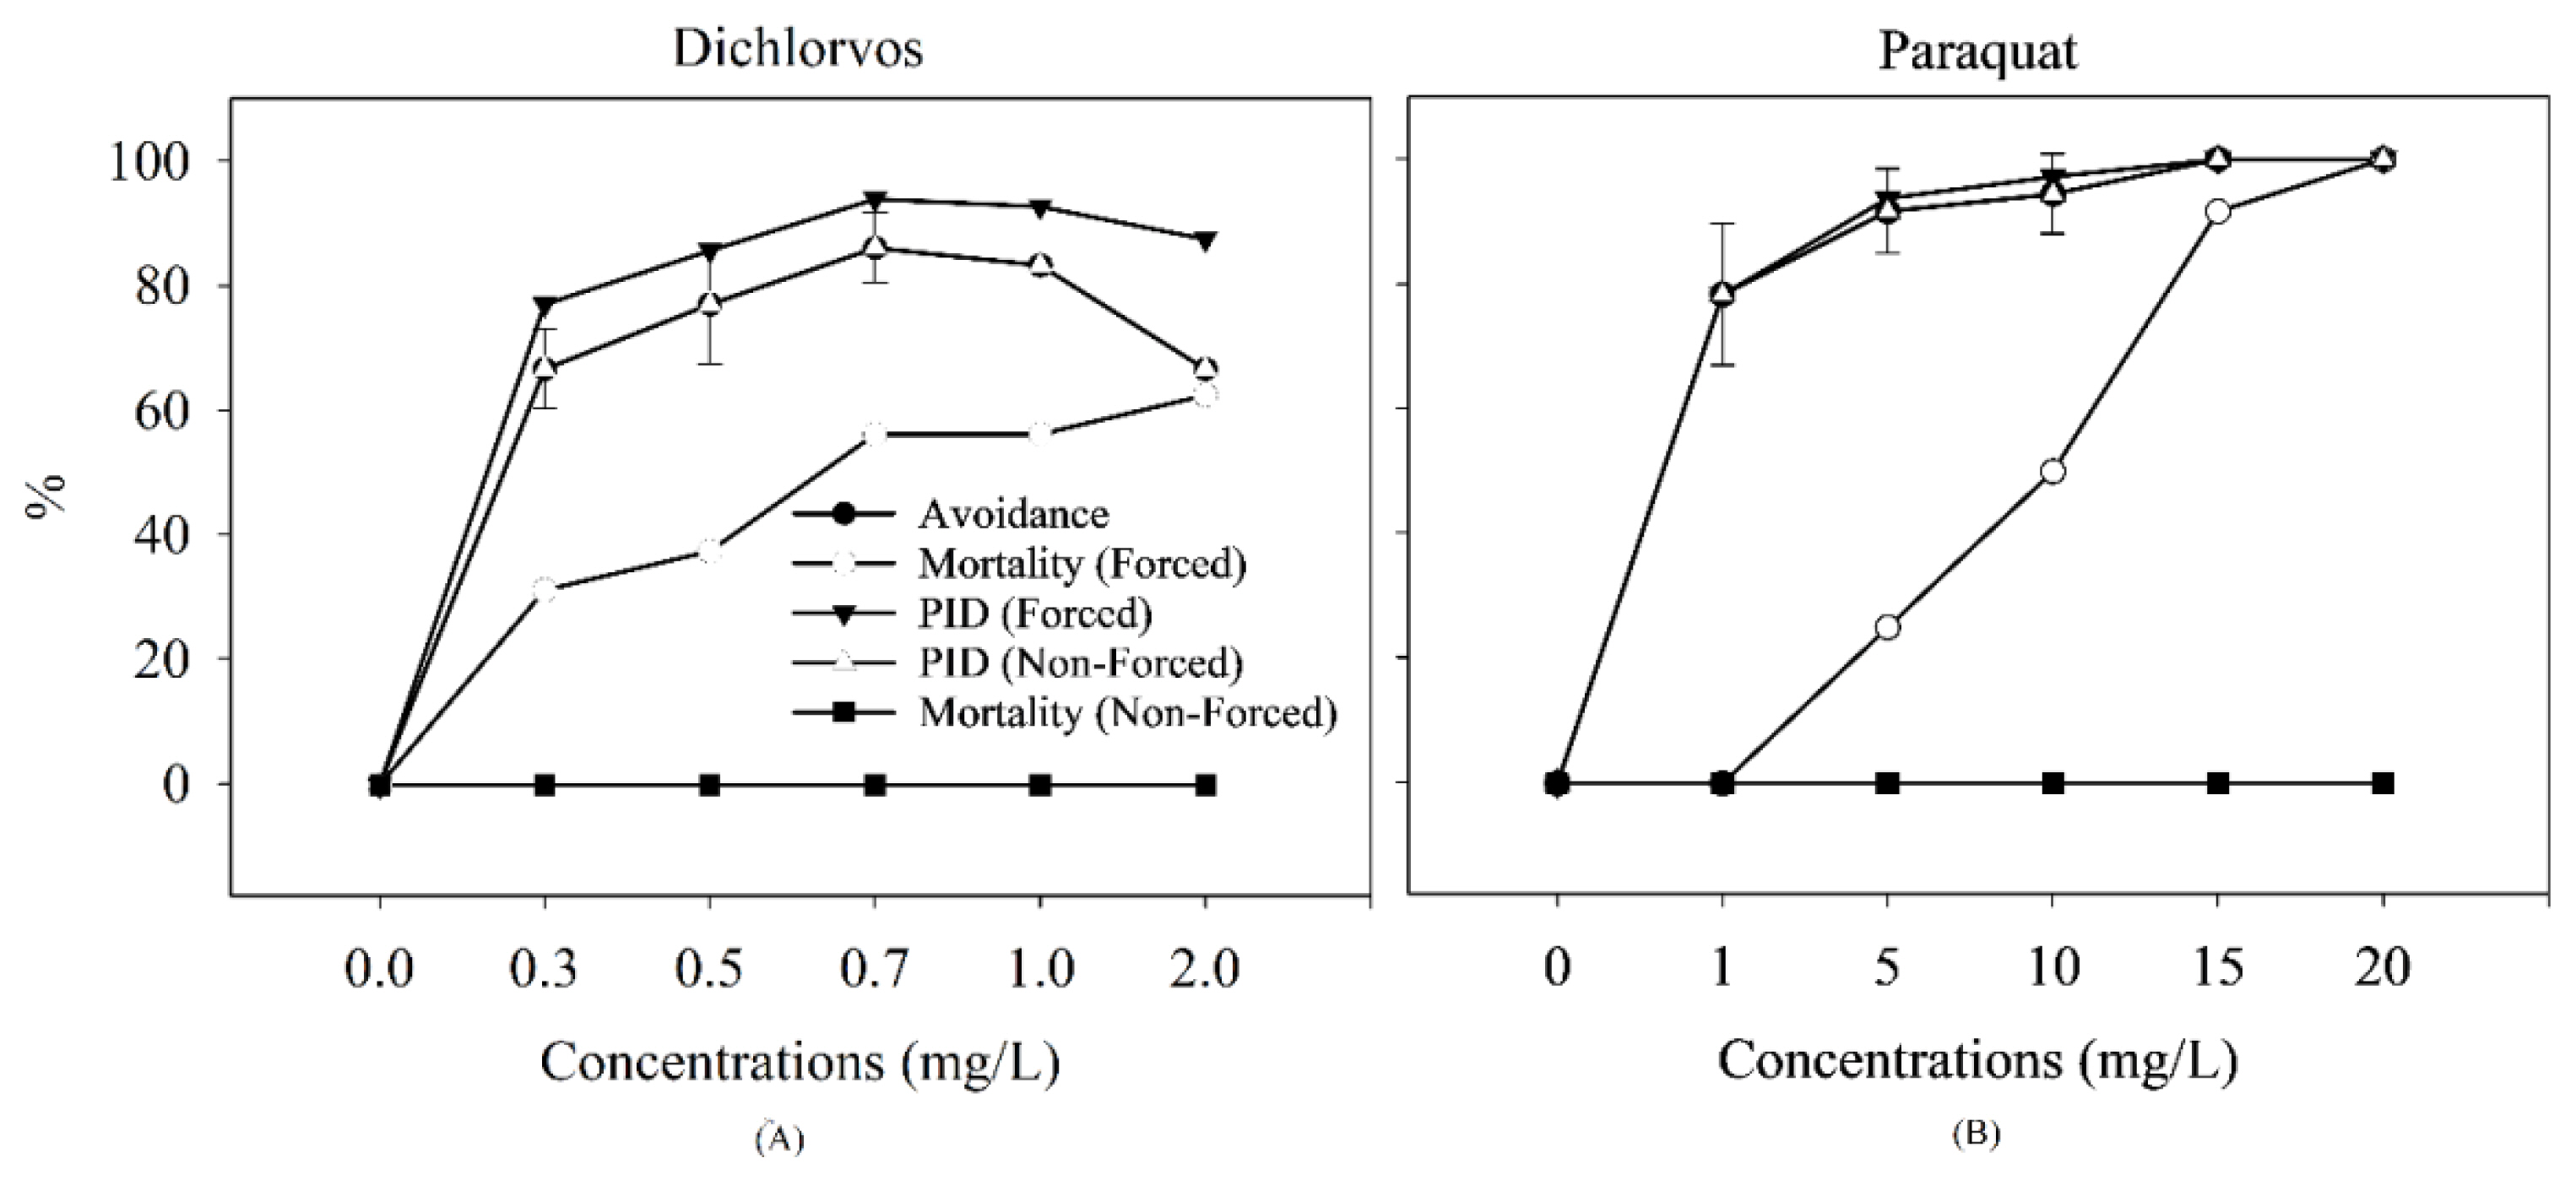
The avoidance, mortality, and estimated PID data (in %) for A. regularis exposed to contamination gradients of both pesticides are shown Figure 4. The PID curve for non-forced exposures followed the same trend as the avoidance curve. This is because no mortalities were observed during the NFS assays in both experiments (Dichlorvos and Paraquat).
Comparison between the AC50 and LC50 values showed that avoidance response was more sensitive than mortality in both experiments Table 3. On the other hand, the AC50 (NFS) and PID50 (FS) values were very similar especially given that avoidance response was more sensitive in both substances tested. Considering only the data from the NFS, the PID50 and AC50 values were the same, since mortality was not relevant at either concentration. In fact, the LC50 values (>2 and >20 mg/L for Dichlorvos and Paraquat, respectively) for NFS were not calculated, due to absence of mortality. Overall, for Dichlorvos and Paraquat exposures, avoidance was about 26 and 36 times respectively more sensitive than mortality Table 3, thereby indicating their relative importance in the PID.
Discussion
This research investigated the ability of A. regularis tadpoles to avoid contaminated environments, and the role of pesticides; Dichlorvos and Paraquat as potential environmental disturbers bringing about a decline in their local population due to avoidance. The 48 h LC50 value (0.79 mg/L) observed for Dichlorvos under FS exposure was similar to that observed for Leuciscus idus (0.45 mg/L) [13] and 0.48 mg/L observed for Lepomis macrochimus by Kenaga [39] for the same pesticide. For Paraquat, the 48 h LC50 value (6.46 mg/L) from the present study was over four times more toxic than that observed by Linder et al. [40], who reported a 96-h LC50 of 1.3 mg/L in leopard frog embryos (Rana pipiens). Osano et al. [18] however, observed a 48 h LC50 value of 14.55 mg/L when tadpoles of Xenopus laevis were exposed to Paraquat, which could have resulted from the protocol for FETAX experiment using analytical grade Paraquat. Considering their continuous use in farmlands, the investigated pesticides are likely to occur at high concentrations in the environment when there is consistent misuse and abuse. There is dearth of information regarding the environmental occurrence and presence of these substances in aquatic ecosystems in many developing countries, including Nigeria. However, measured global concentrations in aquatic environments ranges from 0.0045–5.63 μg/L [41–43] and 0.01–134.08 μg/L [44–46] for Dichlorvos and Paraquat, respectively. Therefore, the concentrations used in assessing acute toxicity in the present study can only be said to be of environmental relevance when considering local discharges.
In the NFS study, the random distribution of tadpoles along each system in the absence of contamination proved that there were no cofounding factor eliciting organisms’ preference for any compartment. This observation was in conformity with previous studies on tadpoles of Leptodactylus latrans, Lithobates catesbeianus, and Pelophylax perezi [32,33] where distribution patterns did not re-orientate when exposed to uncontaminated culture water under similar multi-compartmented non-forced exposure system. Studies with other organisms such as freshwater shrimp Palaemon varians [35], the freshwater fishes, Danio rerio [31] and Poecilia reticulata [34], also exposed to uncontaminated culture water in similar NFS avoidance systems, did not show preference to a particular compartment. These observations validate the NFS as suitable for use in the study of preference and spatial avoidance behavior in organisms exposed to contaminants in a concentration gradient.
Behavioral responses evaluated under FS conditions are usually considered a link between biochemical/physiological disruption and environmental processes [20]. However, the behavior of an organism exposed to stress tends to be the first visually evident response resulting from impairment in the sensory, hormonal, neurological, and metabolic systems [19]. Since contaminant concentrations causing avoidance have been noted to precede concentrations causing toxic effects (i.e., they are expected to occur earlier than toxicity thresholds), it will only make sense to perform behavioral studies using systems that permits the free movement of organisms between environments, in order not to ignore the extent and implications of responses in a more realistic way. Therefore, results from NFS experiments confirms the ability of A. regularis to not only detect, but also to significantly evade sublethal concentrations of Dichlorvos and Paraquat in the environment, thereby reinforcing their importance as indicators of potential environmental risk [19,20].
Notably at the lowest concentrations (0.3 mg/L and 1 mg/L for Dichlorvos and Paraquat respectively), A. regularis showed avoidance of about 41.67% and 58.33% respectively after 1 h of exposure which increased significantly to 66.67% and 78.33 % after 3 h of exposure (Tables S2a and S2b-Supplementary material). These observations demonstrate how tadpoles can detect and escape low concentrations of the pesticides in contaminated habitats within the shortest period of time. This makes sense especially when considering the time taken for toxicity to become evident in FS conditions because, in nature, the functions of toxicity are usually defined by time. Avoidance studies have similarly been performed using NFS for emerging pollutants of concern. For example, an avoidance of 80% was observed at 0.1 mg/L after 3 h exposure, when Litopenaeus vannamei (decapod) was exposed to copper [47]; about 50% of exposed population of zebrafish (Danio rerio) avoided 1.4 mg/L of the pyrimethanil fungicide [31,33]; about 60% and 57% avoided 0.05 mg/L when the estuarine shrimps Palaemon varians were exposed to gradients of musk fragrances Galaxolide and Tonalide under non-forced multi-compartmented exposure systems [35].
Considering AC50 values, it has been proven that an organism will incline to avoid environmental relevant concentrations of a given contaminant [35]. This is evident from the present study as tadpoles presented median avoidance at 0.03 mg/L which is over a hundredth of the 0.1 mg/L monitored in the environment [41]. Also, the AC50 of paraquat (0.18 mg/L) from the present study was very similar to the 0.13 mg/L observed by Thi Hue et al. [46]. In other studies, Poecilia reticulata exposed to a bisphenol gradient had an AC50 value of 0.15 mg/L, which is below the values considered safe for aquatic environments [34]. Also, P. reticulata avoided very low concentrations of atrazine as well (0.02 mg/L) [48].
Although some organisms were found in compartments with the highest concentration for Dichlorvos, this was largely due to their inability to avoid contamination owing to stupefaction [32]. This for Dichlorvos could have resulted from the inhibition of acetylcholinesterase enzymes, resulting in the impairment of motor nerve fiber in the skeletal muscles [50]. This ultimately exposes susceptible organisms more to the lethal effects of the contaminant. Similar observations have been reported in amphibians [31], Shrimps [35] and fishes [34,49].
The PID concentrations were estimated by integrating both FS and NFS responses and results obtained showed great similarity with avoidance, rather than acute toxicity. This establishes that the sensitivity of an organism to a given contaminant will be most expressed through behavioral responses (in this case, avoidance) rather that death. In other words, it is conclusive that avoidance is a sensitive, obvious and reliable sublethal response that will bring about the decline of tadpole populations than mortality, and this can have important repercussions for amphibian population migration dynamics [33]. Furthermore, while many chemicals are classified based on their lethal potential as low risk, they may however, trigger avoidance behavior and hence, significantly contribute to a local scale population [35].
Based on the observations from the present study, it is fair to say that under natural environments, it is expected that the distribution of the tadpoles will be favored towards a less contaminated territory if the environment observes a contamination gradient. This assertion may be uncommon or be limited to size of the water body, since the assumptions in the design of a linear multi-compartment system used in the present study may not be applicable to large water bodies where contaminants are heterogeneously distributed. However, for avoidance to occur, the total distance of the contamination gradient must favor the escape of the tadpoles to much safer habitats. This implies that if gradient of dispersion is too large, they most probably may not be able to move towards safer habitats before the other environmental effects will begin to manifest [33,51]. That is to say, a successful avoidance from toxicants will depend on the contaminant dispersion as well as the distance to be travelled, the time spent, and the swimming velocity of the organism. In addition, the availability and abundance of food and other resources may be another factor to consider [52]. Therefore, whilst the relocation of organisms from contaminated environments is considered an instinctive resolution for the avoiders [53], it could however, lead to the loss of abundance and biodiversity as an ecological consequence at local scale [28].
Conclusions
The present study reiterated the sensitivity of A. regularis tadpoles to acute concentrations of Dichlorvos and Paraquat exposed under forced conditions. It also confirmed the ability of the tadpoles to detect and significantly avoid the presence of both pesticides in an NFS. Avoidance was a more sensitive and reliable response when compared to mortality, and the PID of A. regularis was proven to be most driven by avoidance responses. Hence, while this study does not seek to replace acute toxicity testing, it recommends the combination of both approaches (FS and NFS) to provide a complementary tool for environmental risk assessment without underestimating the extent of population decline at low concentrations and overestimating lethal effects due to forced exposure, where organisms are not given the option to escape. Also, further avoidance studies assessing various pesticides and their mixtures, as well as influential environmental factors are recommended in order to measure the full environmental implications of agrochemicals on the local distribution of anurans.